

- The market is currently "stuck" in a range. Until the price breaks out of the red box, it's a waiting game. Traders should be cautious as long as the price remains below the downward-sloping moving average.
The NIFTY 50 index opened 0.74% lower, or 180.10 points. The previous close was at 24,177.65, and the index opened at 23,996. The Sensex 30 also closed 0.75% lower in the previous session. Indian equities are facing pressure driven by the surge in crude oil prices. The biggest losers within the Nifty 50 index were Eternal, which fell 2.96%; Tata Motors passenger vehicles, which declined 2.92%; and Hindalco Industries, which dropped 2.83%.
The Nifty 50’s top gainers are Bajaj Auto, which rose 5.25%, and Sun Pharmaceutical Industries, which added 2.00%.
On the other hand, the top performers on the BSE Sensex 30 are Sun Pharmaceutical Industries, which rose 2.02%; Infosys, which gained 1.33%; and Tech Mahindra, which added 1.18%.
The Nifty 50 Technical Outlook:
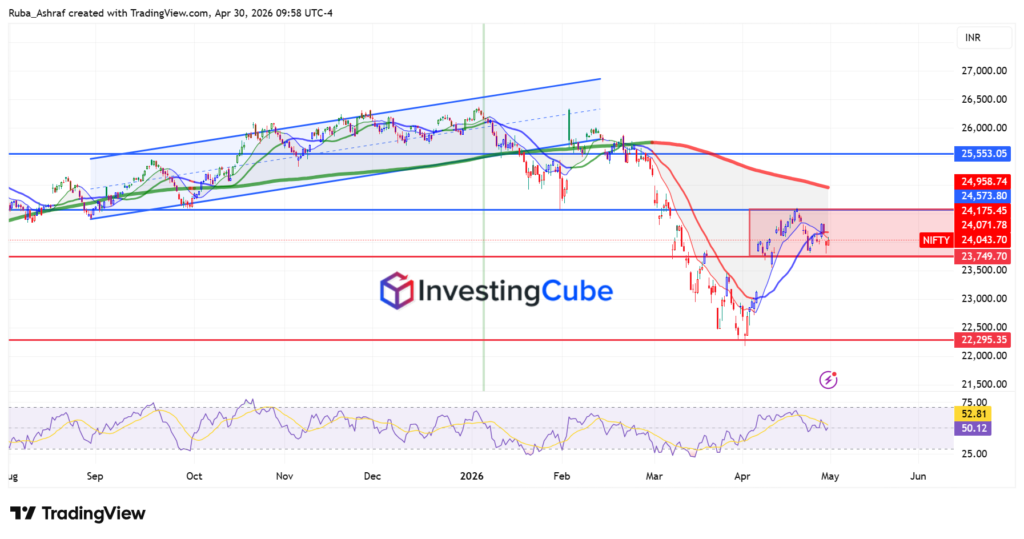
This chart of the NIFTY 50 shows a clear shift in market structure from an uptrend into a strong bearish phase, followed by a potential consolidation.

The price was previously moving into a rising parallel channel. Both the upper and lower boundaries were respected multiple times. This indicated a healthy uptrend. However, the key turning point came when the price broke below the lower boundary of the channel, triggering a sharp sell-off. This breakdown confirmed a loss of bullish momentum and a transition into a bearish trend.
Currently, the price is consolidating within a red resistance box between roughly 23,750 and 24,175. This area is acting like a “ceiling” that the market is finding difficult to break through. The moving averages above the price are sloping downward, which confirms that the path of least resistance is currently to the downside. The RSI at the bottom is hovering around 50, which tells us the market is in “neutral” territory; it isn’t overbought or oversold but is simply waiting for a new catalyst to provide direction.
Potential Scenarios:
- If the index can’t move above the red resistance area and the current bounce starts to fade, we may see the price turn lower again. In that case, it would likely drop back to test the key support level at 22,295. If price breaks below this level, it could signal a deeper decline ahead.
- For a positive move, buyers need to push the price clearly above the 24,175 level and keep it there. If that happens, the next target would be around 25,553, near the long-term moving average. Breaking above that level would be the first real sign that the longer-term uptrend may start to recover.
India is one of the world’s largest importers of crude oil, meaning high oil prices lead to a “double-negative” effect on the economy.
Rising oil prices drive up transportation and manufacturing costs, leading to higher inflation. This often forces the central bank to keep interest rates higher, which can dampen stock market growth.
