
- The Tesco share price continues to range-trade with a downside bias, as price war with Aldi ignites margin compression concerns.
Current and Live Chart
Tesco currently trades as a stock that acts as a hedge against consumer inflation. However, there is a growing discussion about whether the stock is starting to feel the impact of the ongoing energy shock. This situation could ignite food inflation and raise prices at UK supermarket chains. A follow-through from this situation could create intense supermarket competition.
The Tesco share price is also in focus as investors set their sights on the recently-released full-year 2025/26 results. Another anchor point for investors is the capital return signal, following the company’s authorization of a share buyback program.
Grocery inflation in the UK in the four weeks leading up to April 19 stood at 3.8%, according to Worldpanel by Numerator. This print was actually a drop from the prior figure of 4.3%, indicating that the ongoing geopolitical tensions had not impacted supermarket prices. Grocery sales in the UK also rose by 0.9% YoY during that period.
The data also followed a report Tesco released earlier in the month, saying it had yet to see any meaningful inflationary pressures on grocery prices, and debunked a Food and Drink Federation report of a 10% increase in food prices by the end of the year.
Tesco Share Price: Market Drivers
1) Price competition
Aldi/Lidl are starting to come under Tesco’s radar as the company expands its footprint by providing more locations in its “Aldi Price Match” scheme. This is starting to reinforce the price competition narrative after Tesco added 2,000 Express convenience stores as part of the scheme’s rollout.
2) Inflation risk
Despite the recent Worldpanel report, which currently discounts UK food inflation due to the energy shock, there is still a risk that this could become a factor down the road if the geopolitical situation does not ease in the near term. The impact of higher input and logistics costs could start to squeeze margins in the coming quarters.
3) Sales Volumes vs Margin Pressures

Tesco continues to dominate the market share with 28.1% in the 12 weeks leading up to 19 April, up 0.4% YoY. Sainsbury’s is still a distant second at 15.5%. The question remains whether the company can ramp up sales volumes to offset margin pressures from inflation and competition.
Tesco Share Price: Near-term Catalysts
1.UK grocery inflation: This will be a key catalyst over the next three months, as markets watch to see whether the energy risk premium starts to pass through to food prices.
2. Competitive intensity: The Aldi Price Match initiative has kicked off a price war between Tesco and Aldi. Watch out for further competitive actions in the UK supermarket sector.
3.Capital return: How will sentiment be shaped by capital return programs such as the recent buyback scheme? The pace and size of any future buybacks will shape sentiment around the Tesco share price.
Tesco Share Price Forecast Scenarios
Base case: Tesco share price to consolidate, but any upside moves will be capped by concerns over margins if price competition heats up.
Bull case: Headlines or days that indicate the brand is managing cost increases well and can defend its market share without additional margin erosion. Furthermore, the buyback supports positive repricing.
Bear case: If food inflation starts to set in and price war deepens to the point of margin erosion, this could drive the Tesco share price lower.
Tesco Share Price Outlook
The support trendline on the daily chart is currently under pressure. A breakdown of this trendline invalidates the evolving ascending triangle and puts focus on the next support target at 464.15, the prior low of 11 March. Below this point, additional downside targets are found at 455.20 (prior high of 6 January) and 435.10, the 17 November and 29 December 2025 lows.
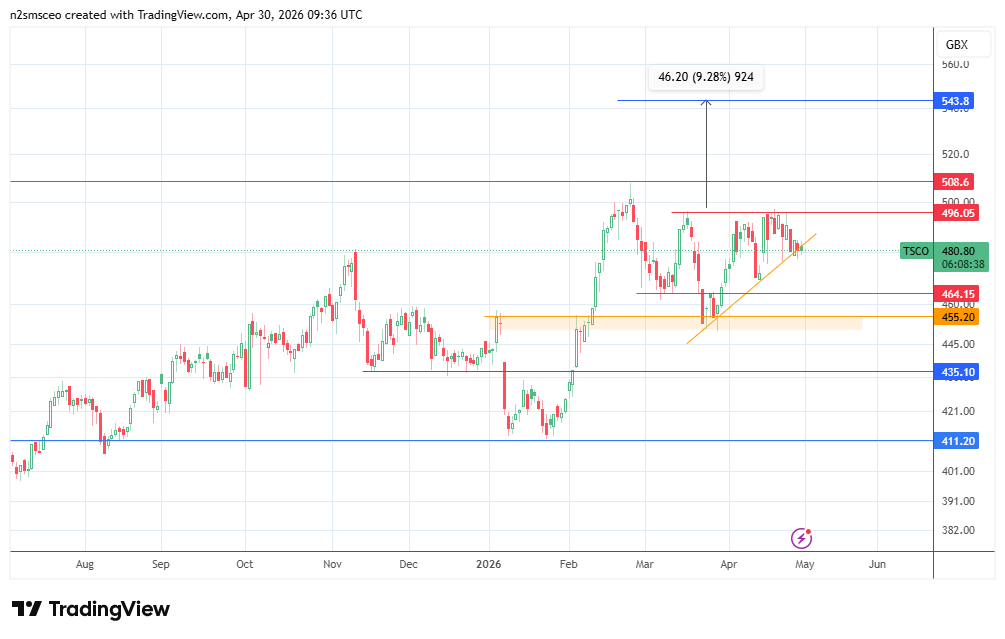
However, a bounce on the trendline that eventually uncaps the ascending triangle’s upper border at 496.05 (the 17 March and 20 April highs) could unlock the 508.00 record high, last seen on 24 February. A break of this barrier shifts focus to a potential measured move completion point at 543.80.
