Archived Article This article was published more than 5 months ago. The market data, prices, forecasts, and analysis were accurate at the time of publication but may have changed since then. Please use this article for historical reference only and refer to our latest content for current market information.
- The FTSE 100 was higher 1.65% higher on Wednesday as U.S. futures attempted to shake off the recent bearishness in the market.
The FTSE 100 was higher 1.65% higher on Wednesday as U.S. futures attempted to shake off the recent bearishness in the market. The Dow Jones is down around 8% from last week’s highs and traders are concerned that the bull market may have expired.
The economic calendar is quiet today so the market will attempt to build a base at the current levels.

Astrazeneca was lower on the day after the company saw its vaccine trial paused due to an adverse reaction in one of the patients. I recently wrote a bearish article on the drugmaker and if the phase 3 trial is a failure then further lows in the stock will be possible. There are currently nine companies in late-stage trials and some of these will lose the race for a vaccine.
There are heightened concerns in Europe over a resurgence of the coronavirus, with France tightening rules, and cases in Britain spiking as schools go back to in-person classes. Stock markets may have seen their peak as the flu season gathers pace in Europe. Tomorrow sees a rate decision from the European Central Bank and traders will be watching the press conference to weigh up the potential for further stimulus.
FTSE 100 Technical Outlook
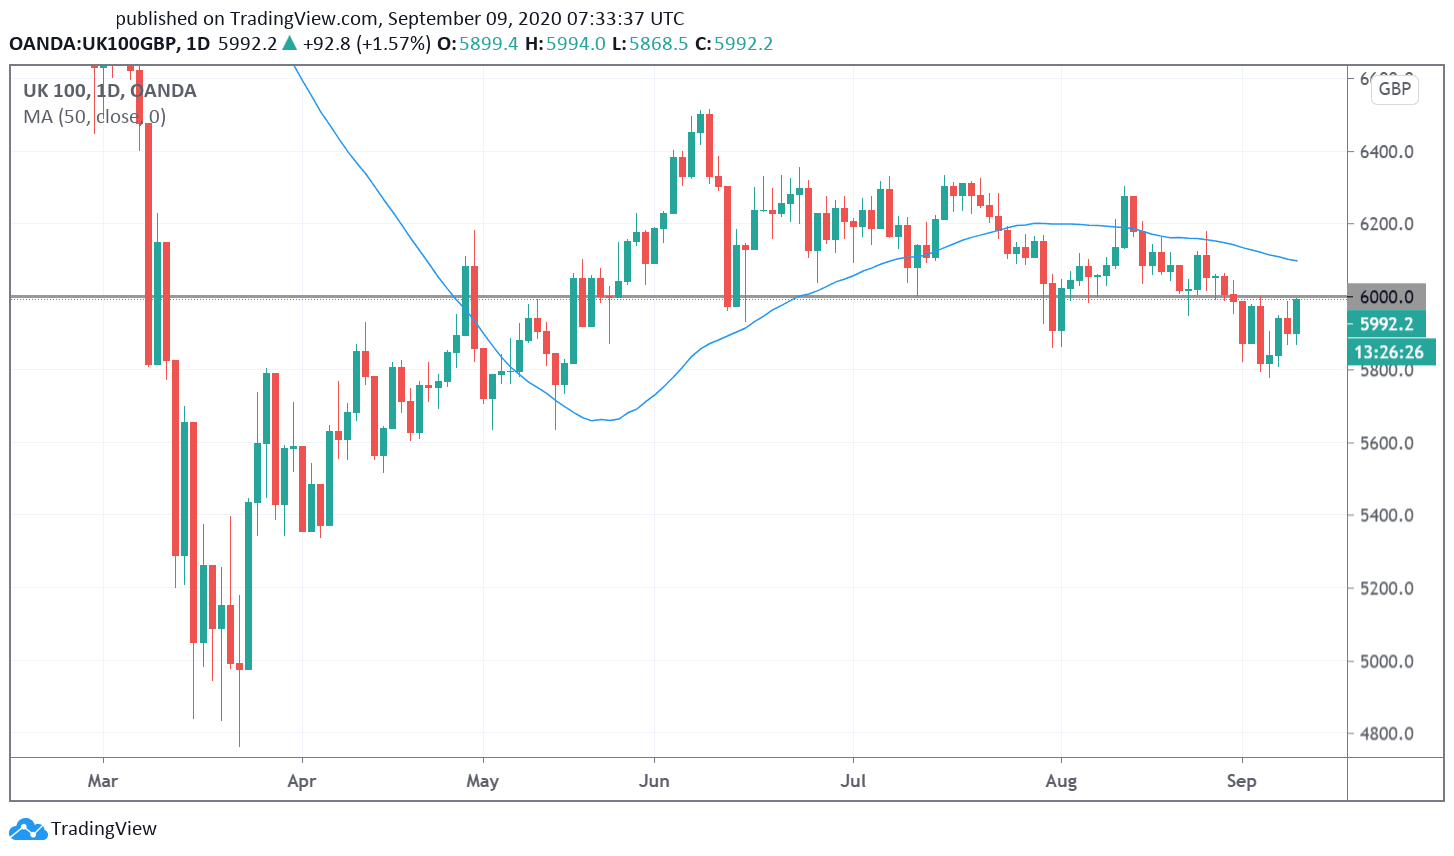
The FTSE 100 was pushing against the 6,000 level and the previous support there in June and early-August give hope that a technical bottom is possible, with the 6,300 level being a target. The 5,800 level is support for a bullish move and below there, the index could see a broader sell-off.
FTSE 100 Daily Chart