


Archived Article This article was published more than 5 months ago. The market data, prices, forecasts, and analysis were accurate at the time of publication but may have changed since then. Please use this article for historical reference only and refer to our latest content for current market information.
- GBP/INR struggles near 105.47 as Pound weakens and Rupee gains. Key levels 106.08 resistance and 104.50 support. Will the pair break lower?
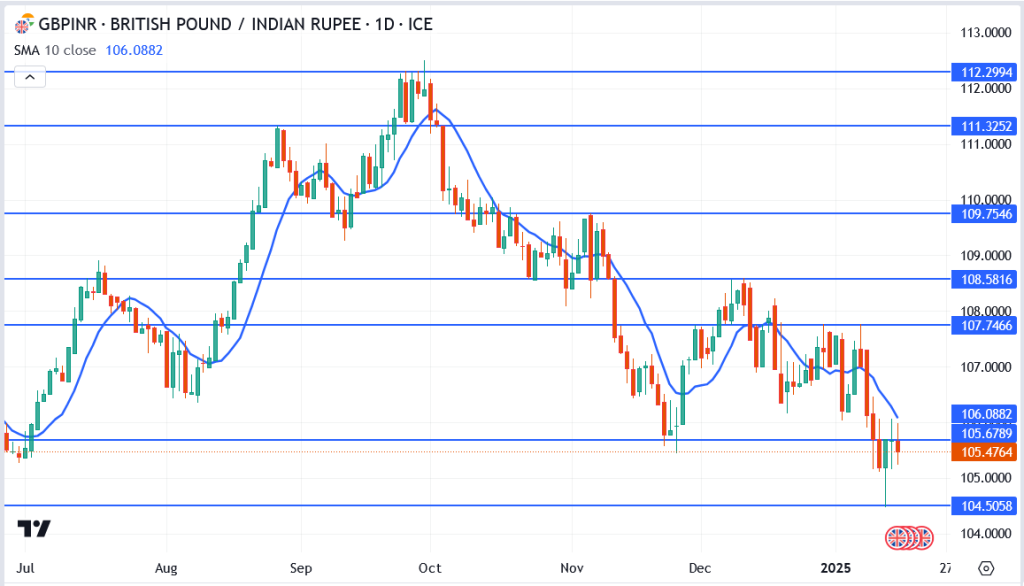
The British Pound to Indian Rupee (GBP/INR) pair is under significant pressure, trading at 105.47, just above a critical support level of 104.50. After a sharp sell-off in recent weeks, the pair has failed to reclaim the 106.08 pivots, signalling a bearish tone in the short term.
The Indian Rupee’s resilience has been bolstered by strong foreign inflows and positive macroeconomic data from India, further weighing on the Pound.
GBP/INR Chart Analysis
- Current Price: GBP/INR is trading at 105.47, hovering just above the key support level of 104.50.
- Trend Direction: Bearish, with the pair consistently posting lower highs and lower lows since November 2024.
- Moving Average:
- The 10-day SMA at 106.08 acts as immediate resistance, reflecting ongoing selling pressure below this level.
- Support Levels:
- 104.50: A critical support zone, tested multiple times in the past, and a potential area for a rebound.
- 105.00: A psychological level that could trigger further downside if breached.
- Resistance Levels:
- 106.08: Immediate resistance aligned with the 10-day SMA.
- 107.74: Key resistance level from December 2024, marking a failed breakout attempt.
- 108.58: A strong resistance that needs to be cleared for a bullish reversal.

Key Watch Points
Traders should monitor daily candlestick patterns around these levels for potential reversal or breakout signals.
A break below 105.00 could accelerate selling pressure, targeting the 104.50 level or lower.
A rebound above 106.08 would be the first signal of potential bullish recovery, but upside is capped at 107.74.
Outlook: Will GBP/INR Sink or Swim?
The GBP/INR chart is teetering on the edge of drama, with the 105.00 level playing the role of the bold protagonist. Will it hold strong like a hero, or will it crumble under pressure, unleashing a flood of bearish sentiment? If the bears break through, the pair could dive toward 104.50—cue the dramatic soundtrack.
On the flip side, the bulls aren’t out of the game yet. A breakout above 106.08 could spark a comeback story, with resistance levels at 107.74 and 108.58 waiting in the wings for their curtain call. It’s a tug-of-war with plenty of twists ahead—watch closely because this is one market plotline you don’t want to miss!