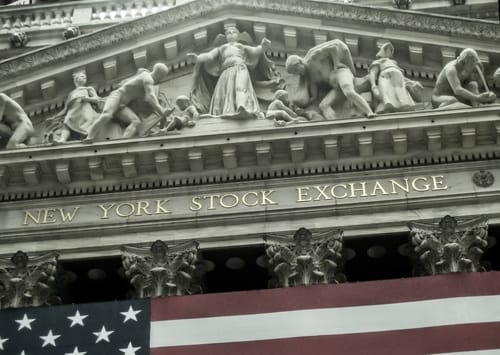
Dow Jones index continued rallying as investors cheered the promising data from Europe. Several European countries, including Belgium and Italy have started deliberating on easing the strict lockdowns that have been there since last month.
In addition, investors are pleased that the White House and congress are deliberating on a new round of stimulus that could be worth an additional $2 trillion.
Hopes that a crude oil deal will be made is another reason for the current rally. Saudi Arabia and Russia are said to be inching closer to a deal while G20 ministers are said to meet on Friday to deliberate on these prices. All this increases the likelihood of a deal. (Still, as I wrote earlier today, this does not mean that oil prices will rise in the long term). Exxon Mobil and Chevron stocks rose by more than 2% in the premarket trading.
All these are positive moves. However, investors and traders should not be complacent because risks remain. Indeed, the coming week will probably be the most important because it will mark the beginning of the earnings season. Big banks like Wells Fargo, JP Morgan, and Citi are expected to start releasing their numbers on Tuesday.
Here’s another reason. The Dow tends to have its best days ahead of a major crash. For example, in the past financial crisis, the Dow Jones rose by 11.08% on August 13th. It then rose by 10.88% on 28th of the same month. The Dow then went ahead and fell to a low of $6530 in 2009. This was its lowest level during that crisis. You can find this data here. Therefore, the current earnings season and the rising uncertainty about COVID-19 in the United States could see the index retrace its past steps.
Download our Q2 Market Global Market Outlook
Dow Jones Technical Analysis
Looking at the four-hour chart, the index has risen and is approaching $23,750, which is along the 50% Fibonacci Retracement level and along the 200-period exponential moving average. The index will likely remain in a bullish trend if it trades above the 50% Fibonacci level. This Fibonacci is derived by connecting the highest point in February with the lowest level in March.
An alternative scenario is where the index turns lower after hitting this Fibonacci level. This is because in some cases, the price typically retraces after hitting either the 38.2% or the 50% Fibonacci levels. If this happens, the index may retest the $20,770 support
Don’t miss a beat! Follow us on Telegram and Twitter.
More content
- Download our latest quarterly market outlook for our longer-term trade ideas.
- Follow Crispus on Twitter.
- Do you enjoy reading our updates? Become a member today and access all restricted content. It is free to join.

