While investors typically use technical and fundamental analyses to make their investment decisions, fear and greed are the two strongest emotions that often have their way. The Fear and Greed Index is a market indicator developed by CNN and it helps investors assess whether market prices are fair or skewed. The components of the Index include safe haven demand, stock price breadth, market volatility, put and call options, stock price strength and stock price momentum and junk bond demand.
Fear and Greed Index is currently at 61, indicating that “Greed” sentiment is currently dominating the market. However, this is a decline from a week ago when it was at 67, and a month ago when it was at 66. Therefore, there’s a decline in the level of greed in the market. The range between 56 and 75 is interpreted as “Greed.”
Breaking down the components of the Fear and Greed Index
Safe Haven buying has risen significantly in recent days. In the context of safe haven buying, the Fear and Greed Index measures the difference between the returns generated from stocks and those generated from Treasuries over the past 20 days. Treasuries are safe haven assets, while the risk level in stocks is higher. Therefore, an increase in their demand relative to the demand for stocks is interpreted as fear, while the opposite is means greed. As of this writing, the Safe haven demand has fallen, signaling Greed sentiment.
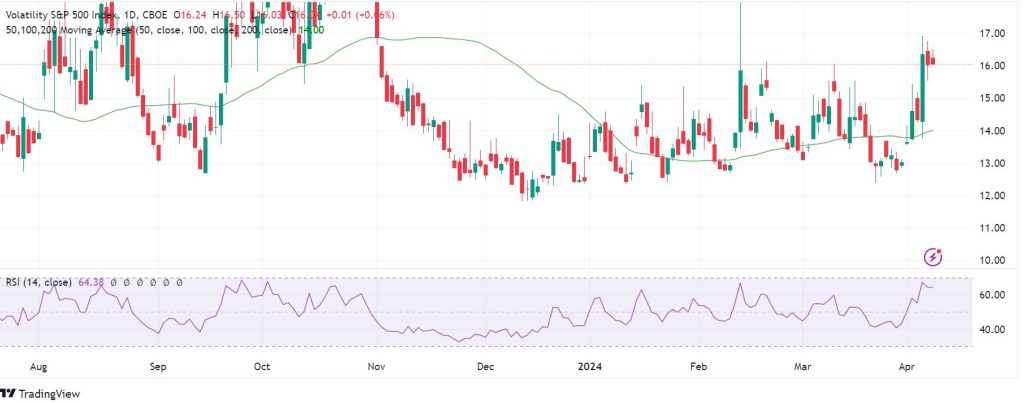
The Market Volatility on the Fear and Greed index is based on the Cboe Volatility Index (VIX) weighed on a scale of 50-day MA. Specifically, it is a measure of the price changes on the S&P stocks over the next 30 days. The VIX rises in bearish markets and declines in bullish markets. The VIX index is currently above the 50-day MA, signaling that the fear sentiment is currently dominating the market. The CNN Greed and Fear Indicator currently signals that market volatility is driven by “Extreme Fear.”
The Market Momentum parameter looks at the performance of the S&P 500 Index the previous 125 trading days. If the index stays above its 125-day MA, it is interpreted as bullish, while a decline below that mark signals bearishness. As of this writing, the index is well above its 125-day moving average, signaling “Greed”.
The Put and Call Options parameter measures the relationship between Put Options and Call Options. Put Options give investors the right to sell assets at an agreed price before a specified date, while Call Options give investors the right to buy assets at an agreed price before a specified date. When the ratio of Put Options to Call Options rise, it indicates greed. Conversely, when it falls, it is interpreted that fear rules. Generally, a ratio above 1 reads as “bearish.” As of this writing, the Put and Call Options are at “Neutral”.
The Stock Price Breadth parameter measures the volume of shares that are rising versus those that are falling. A high or positive reading signals bullishness while a low or negative value signals bearishness. As of this writing, the figure is a strong positive on the CNN Fear and Greed index, indicating “Extreme Greed.”
Junk bonds are currently attractive
Junk Bond demand tells us the difference between the returns from high-risk or “junk” bonds and low risk or “investment grade” bonds such as government-issued bonds. The spread between these two gets wider when investors are taking on low risk and narrower when taking high risk. For instance, as of this writing, the S&P Index has risen by 1.73% in the last three weeks, while yields on 10-year US Treasury bonds have been swinging within margins of 4 basis points above 4.000 % . The Junk Bond Demand on the CNN Fear and Greed index reads “Extreme Greed” as of this writing.