
Current setup
GRSE is the stock of Garden Reach Shipbuilders & Engineers Ltd and is listed on India’s NSE. It is not a component of the Nifty 50 Index, but is listed in the Nifty 500 and Nifty Small Cap 100 indices.
This stock caught our attention today because it is currently trading in a post-earnings volatility regime. According to Reuters reports following the earnings release, GRSE’s FY26 revenue grew 38% YoY to ₹7,002 crore. Profit after tax rose 42% ToY to ₹748 crore. The company will also pay a total dividend of ₹19.60/share. Of this, ₹12.90 per share has already been paid as interim dividend.
The company’s strong FY26 numbers have prompted a sharp bullish move, followed by an equally steep profit-taking-driven selloff amid heavy turnover. The stock closed at 2930.40, down 4.8% for the session. It is only marginally higher for the week, and the formation of a pinbar with a long shadow on the charts could have massive price implications after the Workers’ Day holiday.
GRSE Share Price: Macro Drivers
1.Strong FY26 Earnings Delivery
The stellar revenue and profit prints in the FY 2026 report are currently the main fundamental anchor for the stock. However, the follow-through reaction of the markets in the week that follows is usually a stronger gauge of how the market perceives the numbers.
2. Dividend
Buyers tend to buy on dips if the dividend is attractive enough. GRSE approved a final dividend of ₹6.70 for FY26. This indicates that management is comfortable with the company’s profit position and can pay out some of it to shareholders. However, the market is treating GRSE as a results-and-dividend play, not purely as a dividend play.
3. Sectoral momentum
Defense stocks are currently benefiting from tailwinds amid various geopolitical escalations worldwide. Stocks in the defense sector tend to move together.

GRSE Share Price: Next Week’s Catalysts
Earnings Follow-Through: The initial reaction to the earnings is not always a test of the market’s perception. Usually, the tone of the week following the earnings release reflects the true sentiment, as traders have had time to digest the numbers.
Order Book and Other Performance Metrics: Traders will continue to monitor performance metrics such as the size of the order book, new orders and the execution pipelines. Order visibility is a key performance metric for defense PSUs.
Broad-market risk appetite in India: Defense Public Sector Undertakings (PSUs), which are government-owned entities under the Indian Defense Ministry, are not insulated in a broad risk-off event such as an oil shock, even with strong inherent fundamentals. Therefore, the GRSE share price remains vulnerable as long as the oil shock regime persists.
GRSE Share Price: Forecast Scenarios
Base case: The base case scenario sees a consolidation with wide intraday ranges: GRSE is a high-beta stock that tends to produce overextended moves. Such moves are sharp rallies on dip-buying and equally sharp pullbacks on profit-taking, as was seen in the 30 April session.
Bull case: There will be a strong case for further upside on follow-through buying if traders see the stock as currently undervalued relative to the revenue and profit numbers in the FY26 report.
Bear case: deeper mean reversion: The bear case scenario emerges if there is a broader market selloff due to the oil shock, or if traders rotate out of defense PSU stocks (sectoral selloff). Usually, stocks that have advanced post-earnings are usually the first targeted for profit-taking in the event of tighter liquidity.
GRSE Technical Outlook
The overall trend remains bullish. However, the GRSE share price is attempting a crucial break of the bullish flag pattern as seen on the weekly chart below. The active weekly candle broke past the 2959 resistance, but was immediately followed by a pullback that has brought it back below this barrier. Thus, the breakout remains incomplete.
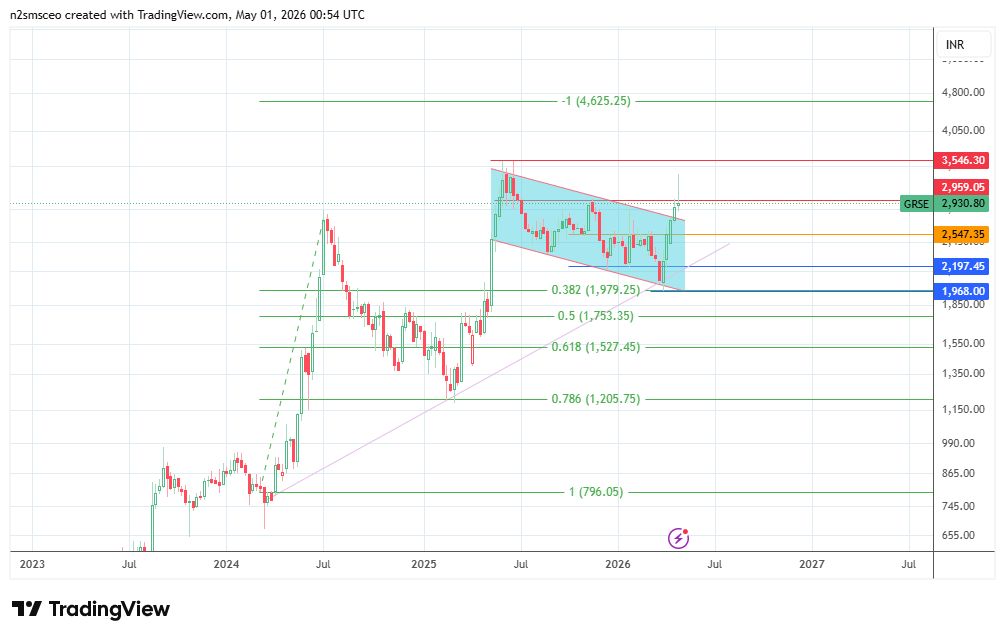
Only a confirmed weekly close above the 2959 barrier with a 1% penetration affirms the breakout. This will unlock the door for the measured move to attemp a push all the way towards the 4625 resistance and the 100% Fibonacci extension of the 4 March 2024 – 8 July 2024 upswing. To achieve this, the 3546 all-time high seen on 2 June 2025 must be uncapped.
This outlook is invalidated if there is a further pullback following the failure of the breakout above 2959. In this scenario, the immediate downside targets at 2547 and 2197 (15 Dec 2025 low) come into focus. If the bears degrade these pivots, the 38.2% Fibonacci retracement at 1979 becomes the next target in view.
