




Archived Article This article was published more than 5 months ago. The market data, prices, forecasts, and analysis were accurate at the time of publication but may have changed since then. Please use this article for historical reference only and refer to our latest content for current market information.
- The Sandbox Price has been free-falling for the last seven days and down almost 35% from last week's all-time high.
The Sandbox Price has been free-falling for the last seven days and down almost 35% from last week’s all-time high. So does the current price offer an attractive entry point for buyers, or will the SAND token get even cheaper?
The Sandbox price received a massive boost towards the end of October when Facebook announced it was rebranding to Meta and pivoting into a Metaverse company. As a result, the decentalized gaming and NFT platform’s native SAND token surged 360% to a record $3.501. However, since then, the price has been sliding lower, towards $2.000. This morning SAND is changing hands at $2.350 (-8.95%), valuing the project at $2.096 billion, ranking it the 75th-largest cryptocurrency behind IoTeX (IOTX).
SAND Price Analysis
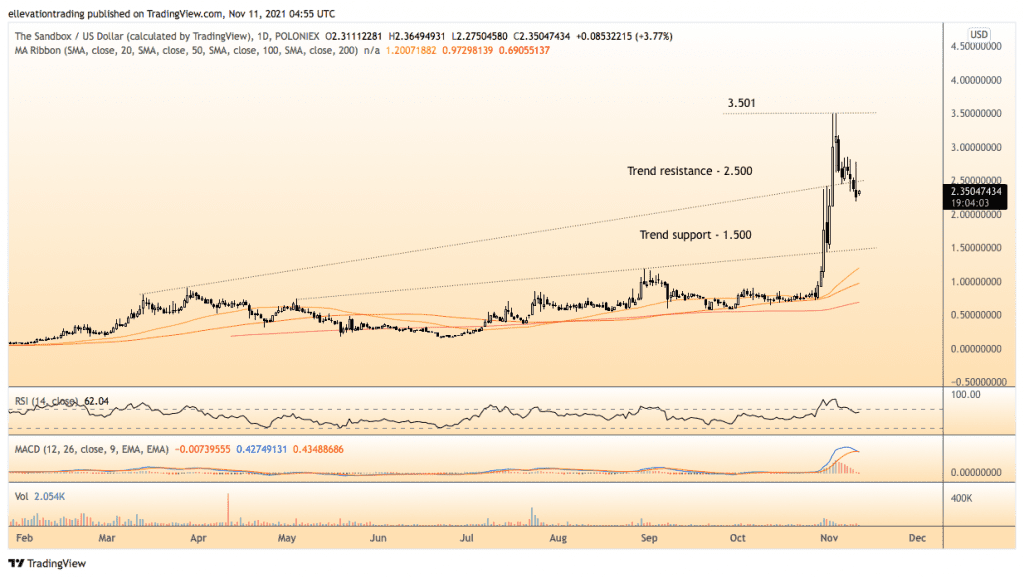
Due to the recent reversal, the Sandbox price sits between significant support and robust resistance. The daily chart shows a rising trend-line from April is the first resistance level at $2.500.

Successful clearance of the trend should set the SAND token towards the all-time high of $3.501. However, as long as the price remains below $2.500, it’s vulnerable to a test of trend support at $1.5000. In my opinion, the path of least resistance is lower. Therefore, I expect the SAND token to slide towards $1.500. However, a close above trend resistance flips to the outlook to bullish, invalidating my bearish call.
The Sandbox Price Chart (Daily)
For more market insights, follow Elliott on Twitter.