
- The Brent crude oil price is pausing today after the EIA released strong rise in crude inventories. The chart pattern hints that the price could fall to $37
Crude oil price is little changed today as traders reflect on the recent plunge and the rising inventories from the United States. Brent is down by 0.15% and is trading at $40 while West Texas Intermediate (WTI) is unchanged at $37.3.
In a report yesterday, the Energy Information Administration (EIA) said that crude oil inventories rose by more than 2 million barrels in the previous week. That was the first time the number of inventories have risen in the past six weeks. Analysts were expecting the data to show that inventories fell by more than 1.3 million barrels.
The recent drawdowns of crude oil inventories is possibly because of the summer holidays. Historically, they tend to fall in August. The report came a day after the EIA released its short-term energy outlook. In the statement, the organisation said that oil prices will likely be higher for the rest of the year. It now expects that spot Brent and WTI prices will average $41.90 and $38.99, which is slightly above the previous forecast of $41.42 and $38.50.
Still, there are serious problems in boosting crude oil price in the near term. For one, American producers have started to add new rigs after slashing them to more than a decade low. More rigs imply that supply will remain high, which is not good for the prices. Another challenge is that Saudi Arabia has started offering discounts to its buyers, which could lead to a price war.
Brent crude oil price technical outlook
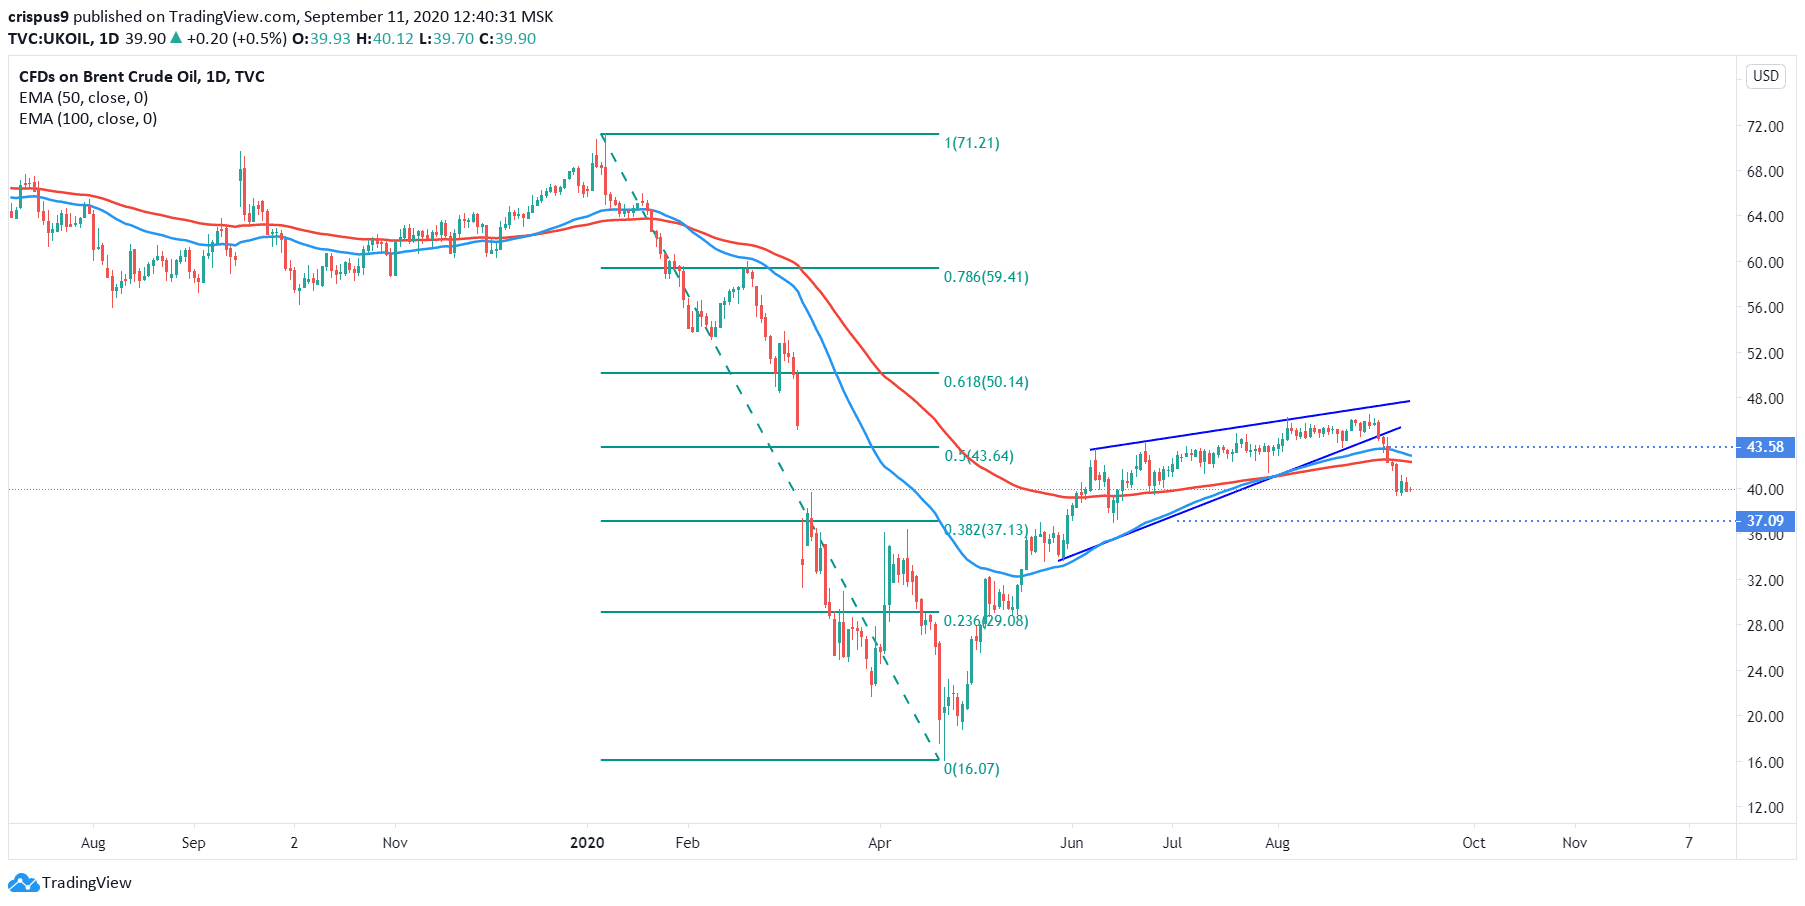
A look at the daily chart shows that the current plunge of Brent crude oil price was not difficult to predict. Indeed, the price started forming a rising wedge pattern since May. I have shown this pattern in blue. Also, the price formed a small inverted hammer pattern on August 31st.

On 2nd September, it moved below the lower line of the wedge and then fell below the 50-day and 100-day moving averages. That confirmed that indeed, bears had prevailed.
Now, crude oil price is forming what seems to be a bearish pennant pattern, which means that it will continue falling. If it does, the next target to watch will be the 38.2% retracement level at $37.00.
On the flip side, a move above the 50% retracement and 50-day EMA level at $43.58 will invalidate the downward trend.
Do you want to be an excellent trader? Register for our free forex trading course and one-on-one coaching by traders and analysts with decades of experience in the industry.
Crude oil technical chart