

- Brent crude oil price is on a path towards $40 as the price moves below the rising wedge pattern. It is falling because of cuts by Saudi Arabia
Crude oil price is in a steep freefall as traders reflect on the impact of the latest decision by Saudi Arabia to slash prices. Brent, the international benchmark is down by 1.52% while West Texas Intermediate (WTI) is down by 3.52%. The two are trading at $38.38 and $41.38, respectively and are down for the past five consecutive days.
In a statement yesterday, Saudi Arabia said that it would slash its October official selling price by $1.50 per barrel. Its oil will have a $0.50 discount against the Middle East benchmark. This was meant to interpret that the biggest oil exporter believes that demand for the commodity will fall in the near term.
The price of crude oil is also falling as investors start to price-in lower drawdowns in the United States as people return back from summer. Last week, data from EIA showed that drawdowns in the US rose by more than 9 million barrels. That was the sixth week in which the inventories have recorded a drawdown. This week, analysts expect the data will show that inventories declined by about 1 million barrels.
The rising rig counts is another reason why crude oil price is falling. On Friday, data from Baker Hughes showed that the total number of rigs in the United States rose to 181. That was a higher number than the existing rigs in August, which stood at 172.

Brent crude oil price technical analysis
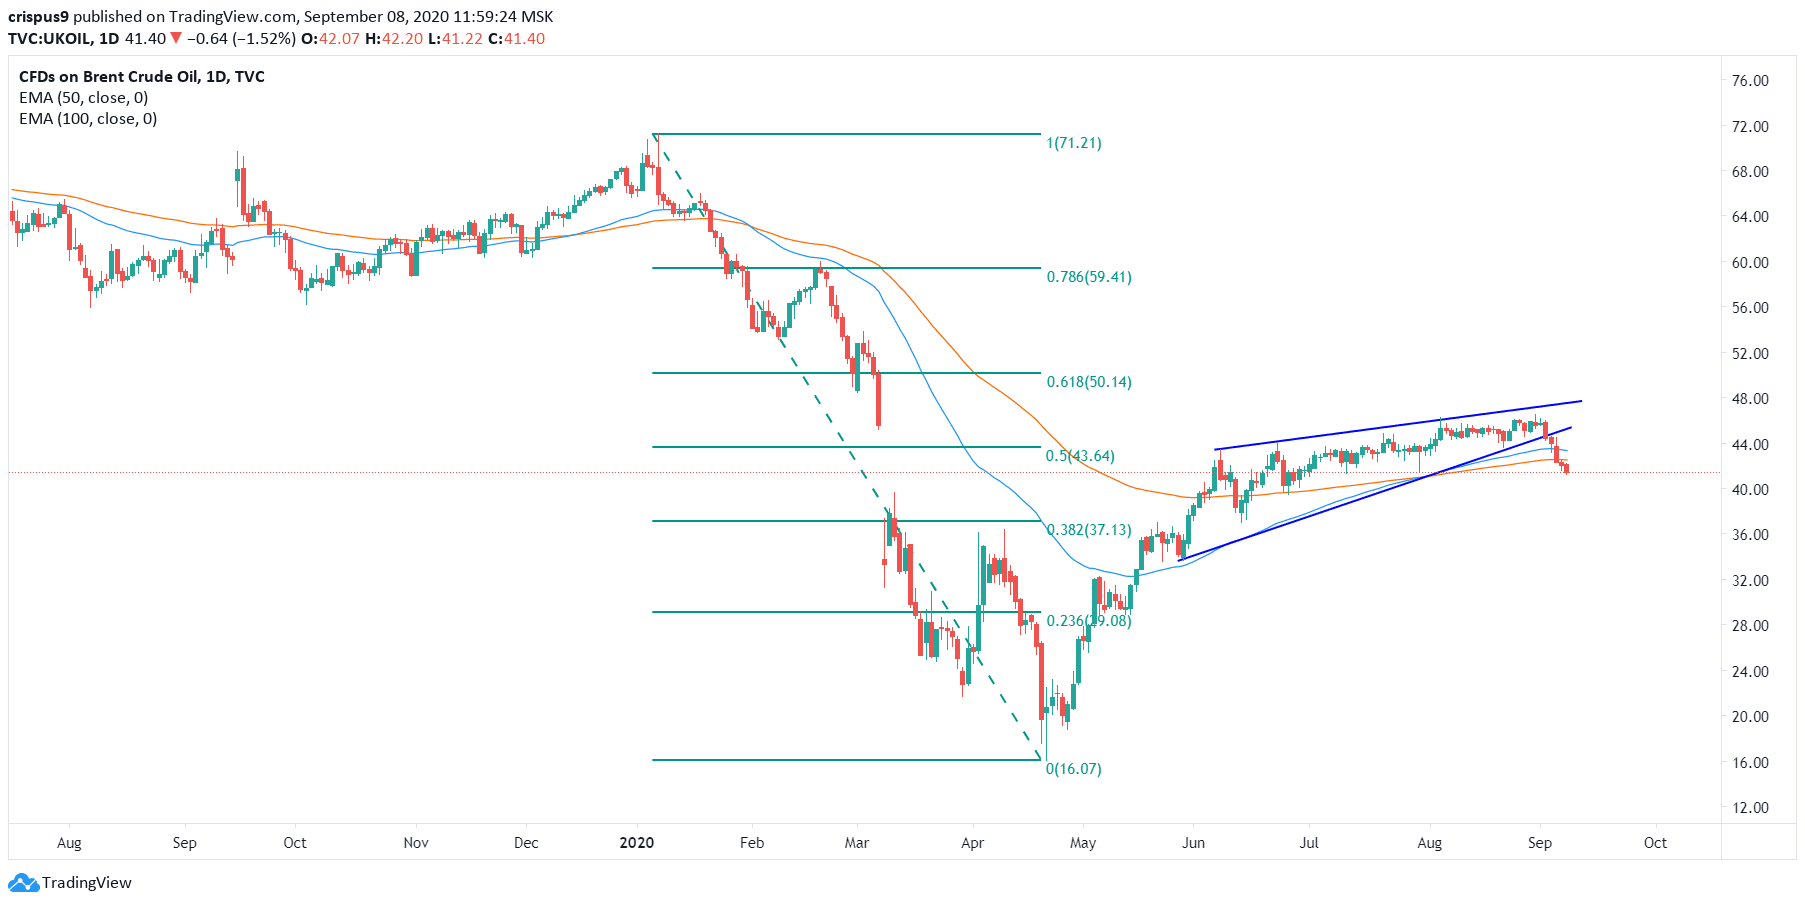
Unknown to many is the fact that technical analysis played a role in the current nosedive of crude oil price. The daily chart below shows that before the current decline, Brent had formed a rising wedge pattern. This is shown in blue. As you can see in our free trading course, a rising wedge pattern is usually a bearish signal.
Now, the price has even moved below the 50-day and 100-day exponential moving averages. It has also moved below the 50% Fibonacci retracement level. Therefore, I suspect that bears will continue pushing the price lower, potentially to $40. On the flip side, a return above the 50% retracement will invalidate the bearish trend.
Brent crude oil price chart