
- The Brent crude oil price is nearing a break-out or pull-back as the rising wedge nears its tip. The number of inventories are falling for weeks
Crude oil price rose by 0.40% during the Asian session as traders reacted to the falling inventories in the United States. Brent and the West Texas Intermediate (WTI) have risen by 0.60% and 0.90% and are trading at $45.95 and $43.13, respectively.
In a statement yesterday, the American Petroleum Institute (API) showed that crude oil inventories in the United States declined by more than 6.3 million barrels in the US. That was a sharper decline than the 1.95 million that analysts were expecting. It was also better than the previous week’s decline of more than 4.5 million barrels. Interestingly, as shown below, inventories have been in the red since July this year. This is the longest streak since June and July last year.
US crude oil inventories have been falling
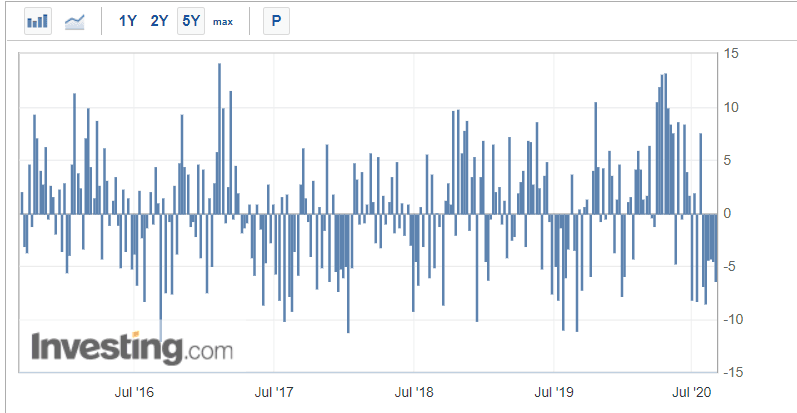
Later today, crude oil price will react to the official inventories data from the Energy Information Administration (EIA). Analysts expect that the data will show that inventories declined by more than 1.8 million barrels in the previous week. If it happens, it will be the fifth consecutive weeks that inventories have been falling.
Meanwhile, crude oil is possibly higher after the strong PMI data released yesterday. According to a report by Markit and JP Morgan, the global manufacturing PMI increased to a 21-month high of 51.8. The same was seen in PMI data from the United States and China that were released yesterday.

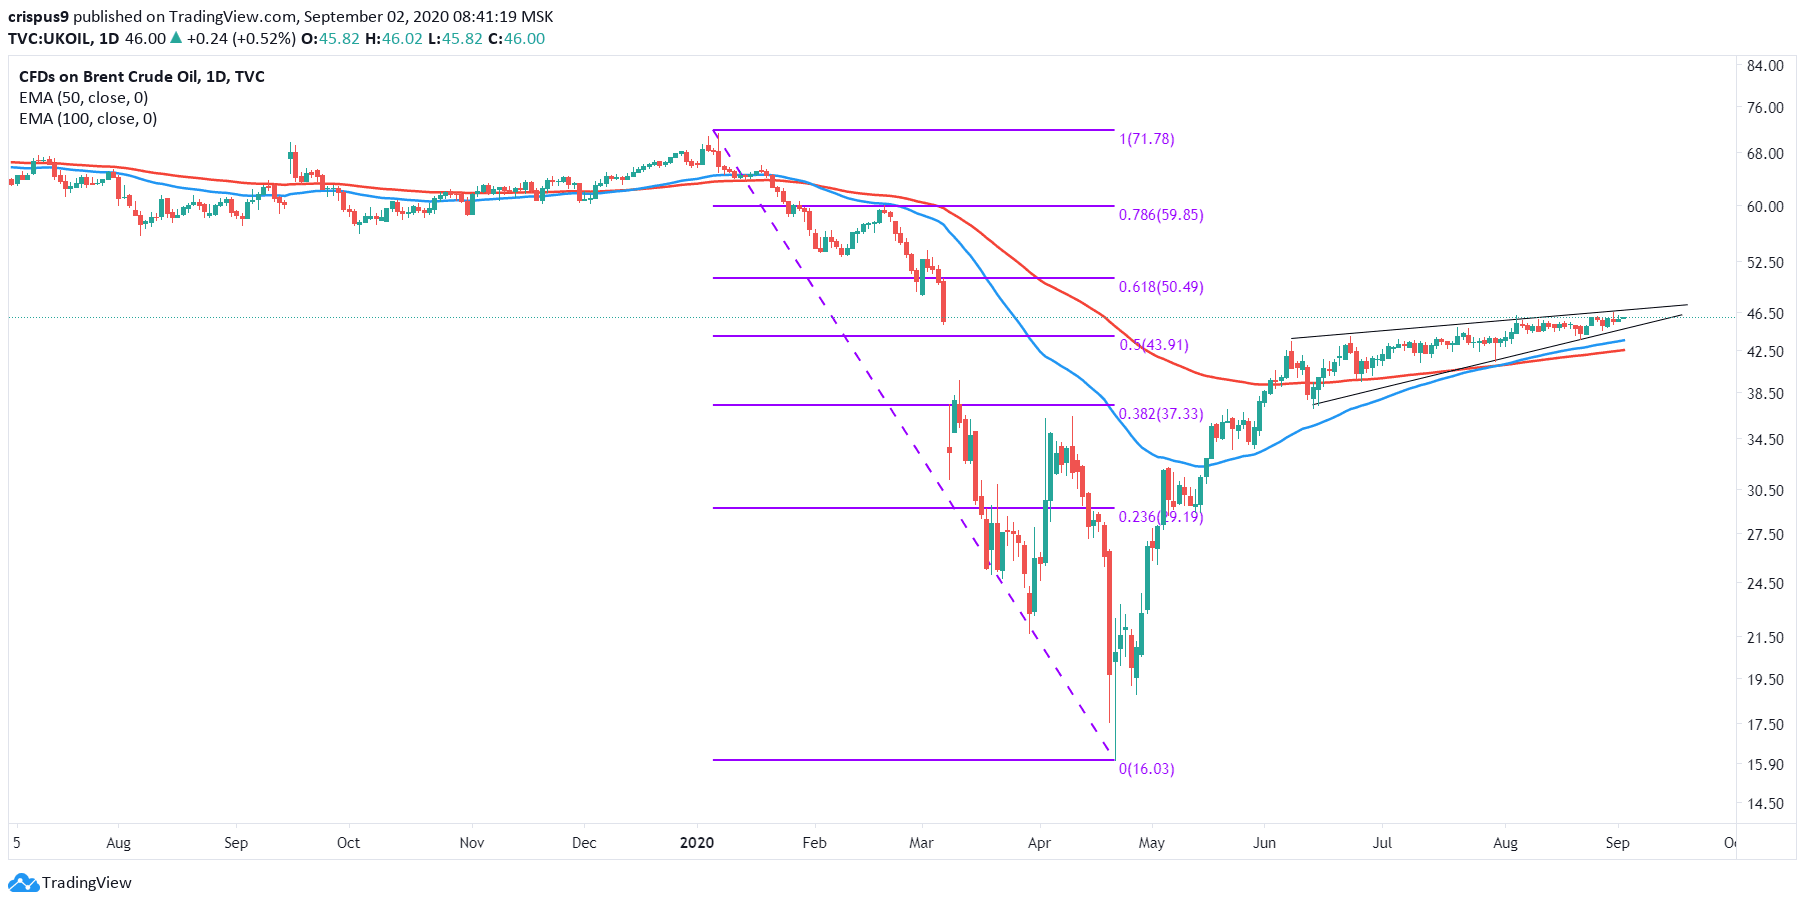
Brent crude oil price technical outlook
The daily chart below shows that the Brent crude oil price has risen slightly in the past two consecutive days. The price is trading at $45.96, which is between the 50% and 61.8% Fibonacci retracement level. The price is also slightly above the 50-day and 100-day exponential moving averages. Most importantly, the price has been forming a rising wedge pattern. As you can see in our trading course, this pattern is usually a bearish sign.
Therefore, with the wedge nearing its tip, there is a possibility that the price will break out lower. If it does, the possible target will be about $40. On the flip side, a move above $50 will signal that bulls have prevailed, which will push the price higher.
Brent Crude Oil Price Technical Chart