The bearish pattern which was mentioned in our last Bitcoin price prediction has broken down. This has triggered a market-wide sell-off. BTC price has also broken the uptrend that it had been maintaining for the past few weeks. While many analysts think that the new lows are only a matter of time, some are still confident that there’s another leg up.
Altcoin prices are experiencing a massive sell-off once again due to the negative price action of Bitcoin. Investors are cautious in deploying their capital as the bullish market structure has been broken on key timeframes.
At the time of writing, Bitcoin price is trading at $21,251. The price is 1.24% down from yesterday. On Monday morning, the price plummeted below $21,000 once again. However, the investors were quick to buy the dip and gave the price much-needed support. You can buy Bitcoin by signing up on top crypto exchanges like Binance.
According to Bitcoin news today, the Government of El Salvador is working on recovery plans for distressed Bitcoin lending companies. In other news, Ted Cruz has encouraged Bitcoin mining. According to the Texas Senator, mining breeds entrepreneurs and results in the prosperity of families.
Bitcoin Price Prediction
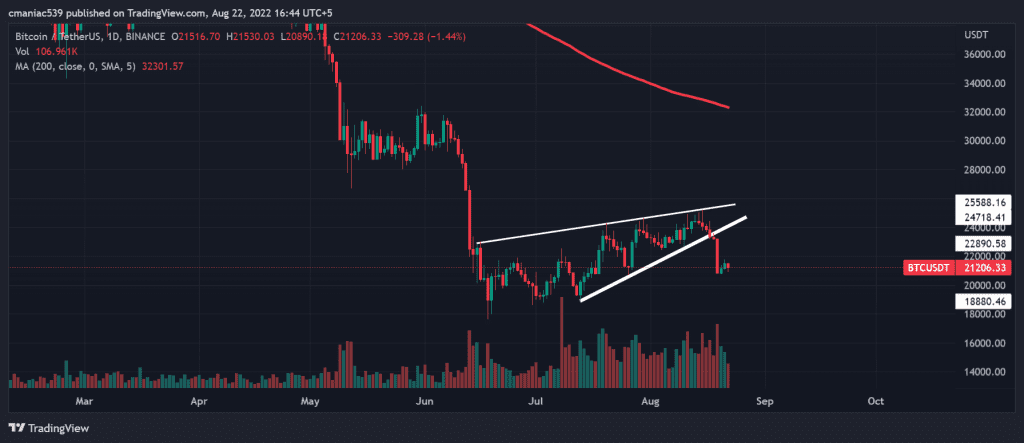
Technical analysis of the BTC price chart shows a clear breakdown of the rising wedge pattern. Since such a pattern is very bearish, so price accelerated in the downward direction very quickly. Bears always target the bottom of the wedge after such breakouts. This gives us a bearish price target of around $19,000.
Another reason behind the above bearish Bitcoin price prediction is the last weekly close below 200 MA. The only way for the price to flip bullish is by reclaiming the 25k level and turning it into support. The price is also likely to face some resistance from the 200-week MA that currently lies at $23,108. Therefore, bulls need to pull something incredible out of their hat to put the price back on the upwards trajectory.
Bitcoin Daily Chart
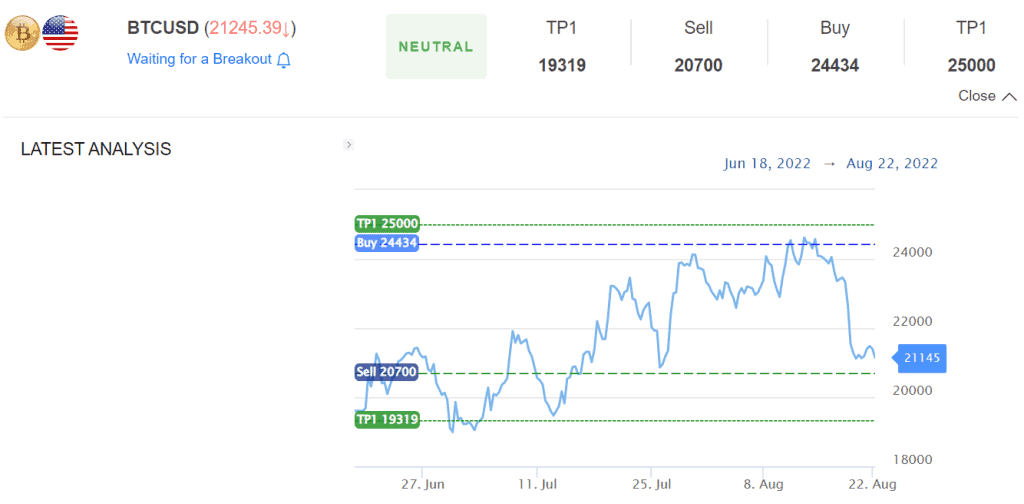
BTC Analysis By S&R Levels
If you’re trading in these tough market conditions, you need to have a reliable trading indicator like S&R Levels in your arsenal. Subscribing to this Premium Indicator keeps you one step ahead in the game.
Currently, the indicator’s Bitcoin price prediction is neutral, and it is awaiting a breakout. An acceptance below $20,700 would generate a short entry with a target of $19,319. As mentioned in our analysis, this target is very close to the measured target of rising wedge breakdown.