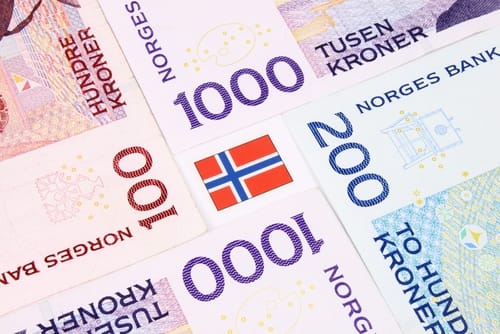
The USDNOK pair declined after the Norwegian consumer prices rose in May. The price ignored the falling crude oil prices after US inventories increased in the previous week.
Norway inflation beats
The USDNOK pair continued to decline after the Norwegian bureau of statistics released consumer and factory pruces data. The data showed that consumer prices rose by 0.2% from April to May. The price rose by 1.3% from may last year to this year. The bureau also said that core CPI, which excludes volatile food and energy products rose by 3.0% from January to May.
According to the bureau, services, which had an almost zero consumption in May accounted for just 4% of the total CPI. This increase was mostly due to a 2.2% increase in car prices. Other contributors were electricity, clothes, alcoholic beverages, and maintenance. On the other hand, laggards were air transport, food and furniture.
The recent temporary decrease in VAT from 12% to 6% also contributed to low consumer prices index.
While consumer prices remained stable, factory prices declined sharply. The producer price index declined by 17.5% between May 2019 and May 2020. This was mostly because of a 47% decline in refined petroleum products and a 44% decline in energy goods. Extraction and related services declined by 38% while electricity and gas fell by 28%. On the other hand, basic metals and food products rose by 5.3%.
The USDNOK pair declined even after the price of crude oil retreated. West Texas Intermediate (WTI) and Brent declined by more than 1% after data by the American Petroleum Institute showed that US inventories rose sharply in the previous week.
Download our Q2 Market Global Market Outlook
USDNOK technical outlook
USDNOK is trading at 9.2378, which is significantly below the YTD high of 12.1485. On the daily chart, the price is below the 50-day and 100-day exponential moving averages. It has also moved below the 78.6% Fibonacci retracement level. I drew this retracement by connecting the lowest and highest points this year. This means that bears are still in total control, which implies that the pair may continue falling. On the flip side, a move above the 78.6% retracement at 9.4740 will invalidate this prediction.
Don’t miss a beat! Follow us on Telegram and Twitter.
More content
- Download our latest quarterly market outlook for our longer-term trade ideas.
- Follow Crispus on Twitter.
- Do you enjoy reading our updates? Become a member today and access all restricted content. It is free to join.

