

- USDJPY in focus this week as US ecnomic indicators dominate economic calendar: speeches from US Fed Chair Powell, US-China trade talks and CPI data.
Friday’s mixed NFP data meant that the USDJPY was unable to command significant trade activity as is usually the custom when the data is properly defined. Presently, the USDJPY has opened the week in muted fashion. But as the week wears on, traders can expect some good volatility on the pair as the FOMC minutes and the US CPI report take center stage. Fed Chair Jerome Powell is also due to speak on two occasions this week.
The weaker than expected employment change, lower wage growth and poor PMI data for the manufacturing and services sectors have started to fuel expectations of possible Fed action in October.
However, the focus for the week will be on the US-China trade talks, the minutes of the September meeting of the Federal Open Market Committee (FOMC) minutes of the prior Fed’ interest rate decision as well as US Consumer Price Index (CPI).
Fed Chair Powell will also deliver a few remarks at a film premier on Monday (not really important) as well as speak at the annual NABE Conference on Tuesday October 8. He will also be a panelist at the discussion sessions at the Fed Listens event in Kansas City.
So for the USDJPY, there is a lot to expect this week.
Download our USDJPY Q4 Outlook Today!
[vc_single_image image=”14654″ img_size=”medium” alignment=”center” style=”vc_box_rounded” onclick=”custom_link” img_link_target=”_blank” link=”https://www.investingcube.com/q4-global-market-outlook-eurusd-gold-crude-oil-bitcoin-sp-500/”]

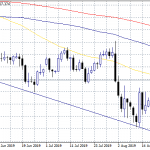
Technical Outlook for USDJPY
The USDJPY has opened the week with a downside gap that took price briefly below the neckline support of the potential double top pattern. This gap has been closed but price has not returned above the neckline.
The critical action to look out for on the charts (technically speaking) is the neckline break, which confirms the double top and opens the door for further downside price activity. A downside neckline break by a 3% penetration factor gives an opportunity for a measured move that takes price all the way to the 105.25 price support area (close of Aug 12/13).
A failed attempt to break the neckline could allow a price recover to the double top area on the 50% Fibonacci line (108.40). Further advance beyond 109.36 (August 1st high) invalidates the bearish pattern.
The US economic indicators mentioned above will sway market sentiment one way or another and provide the basis for the price moves so described.