- What is the outlook of the USD/ZAR Price ahead of the Federal Reserve interest rate decision scheduled for Wednesday this week.
The USD/ZAR exchange rate was flat on Monday morning as investors reacted to last week’s SARB decision and the upcoming Fed meeting. After falling to a year-to-date low of 16.68 on January 12 this year, the USD to ZAR rate was trading at 17.22 on Monday. This price is about 7.50% below the highest point in 2022.
USD/ZAR weekly analysis
The main driver for the USD/ZAR price this week will be the upcoming decision by the Federal Reserve. Being the first meeting of the year by the Fed, the meeting will set the stage for what to expect later this year. It is also an important meeting because it comes at a time when the American economy is at crossroads. Inflation has dropped for six straight weeks while retail sales have plunged. Last week, the SARB made a smaller hike, signaling that the end of its rate hiking cycle was near.
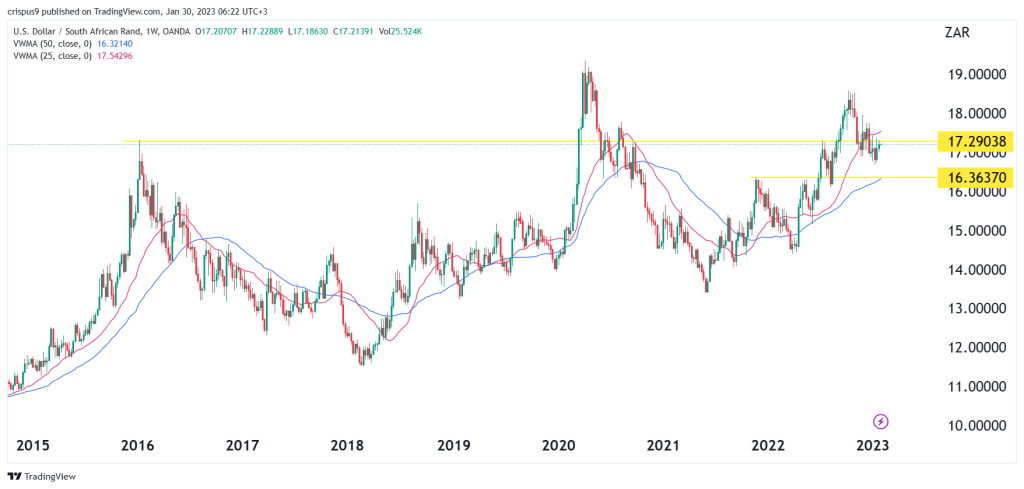
The chart shows that the USD to ZAR price is trading at an important level since it was its highest point on January 2016 and July 2022. This price is also about 7% below the highest level in 2022 and a few points above 16.36 (November 29, 2021). It has also formed what looks like a double-top pattern, whose neckline is at 13.40. The price is between the 50-day and 25-day volume-weighted moving average (VWAP).
Therefore, the outlook of the USD/ZAR price on the weekly chart is still bearish, with the main price to watch being at 16.36. At the same time, the stop-loss of this trade will be at 18, which is about 4.45% above the current level.
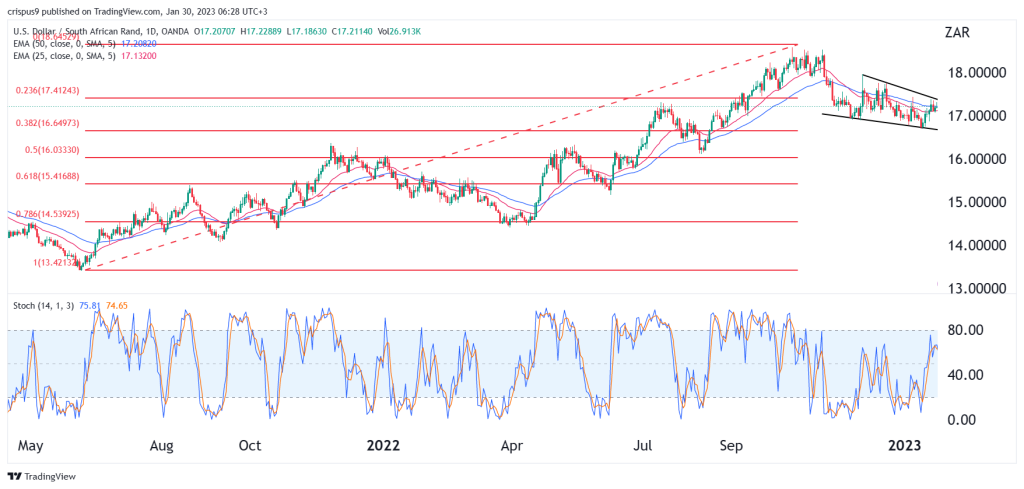
USD/ZAR daily chart analysis
The USD/ZAR price has moved below the important 23.6% Fibonacci Retracement level on the daily chart. It has also formed what looks like a falling wedge pattern, which is usually a bullish sign. The price is also oscillating at the 25-day and 50-day exponential moving averages while the Stochastic Oscillator moved slightly below the overbought level.
Therefore, because of the falling wedge, we can’t rule out a situation where the pair rebounds and retests the 2022 high of 18.60. A drop below the falling wedge pattern at 16.73 will invalidate the bullish outlook.

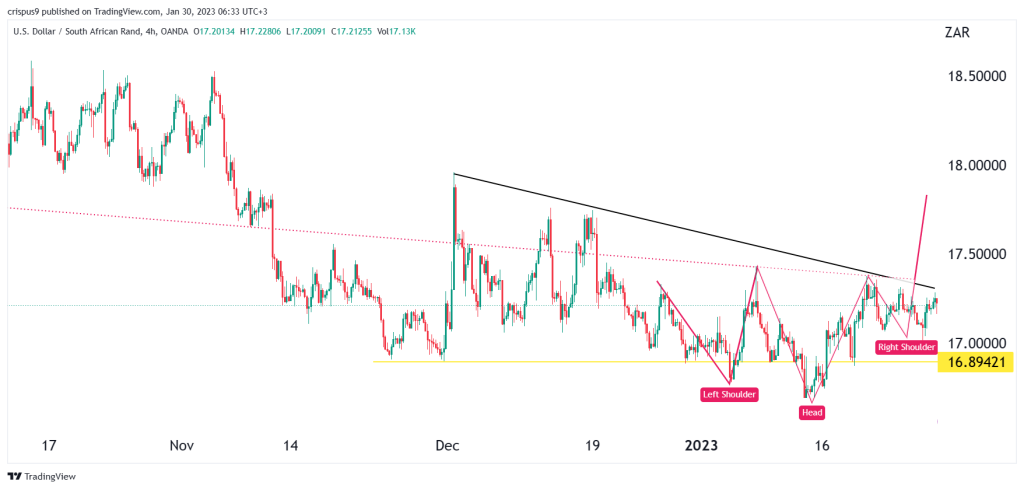
USD/ZAR 4H chart
The USD/ZAR exchange rate has been in a tight range on the 4H chart. This price is slightly below the descending trendline shown in black. It has also formed a small inverted head and shoulders pattern. In technical analysis, this pattern is usually one of the most reliable bullish signs in the industry. The price is slightly below the neckline of this pattern.
Therefore, the pair will likely have a bullish breakout this week ahead or after the Fed decision. Such a move will see it rise to the important resistance point at 17.50. The stop-loss of this trade will be at 17.00. Learn to trade with our free forex education courses.