

- The USD/HKD pair is facing pressure at the upper limit of its trading band. Will the 40-year peg give way under liquidity pressure?
The USD/HKD pair is trading flat, following several days of muted upside movement, as traders look toward the unfolding geopolitical situation in Asia for clues as to the future price direction of the pair.
The latest escalation between China and Taiwan has come from the visit of US House Speaker Nancy Pelosi, who touched down in Taiwan on Tuesday despite warnings from Beijing of potential retaliation. China has responded with a large deployment of heavy military equipment around Taiwan, with reports on Wednesday suggesting that there had been some incursion of a beach in the territory whose sovereignty China has refused to accept.
The situation appears to be putting some pressure on the 40-year-old currency peg. The Hong Kong Dollar has been under pressure for most of 2021 and 2022 as US interest rates rise, forcing the currency board of Hong Kong to intervene to prevent weakening the currency beyond its permitted band. Given the model that ties the HKD’s value to the US monetary policy in an environment of increasing Chinese influence, the Hong Kong Dollar’s peg may face some severe risks going forward.
The Hong Kong Dollar is an example of a currency which does not operate a full floating regime. Instead, the currency operates under a fixed/managed float spectrum, keeping the rates in a very tight range for over two decades. As a result, the USD/HKD has traded between the 7.7500 price floor and the 7.85000 price ceiling in the last 14 years.
Could this be the year when the ceiling finally gives way? This could be the case if the emerging pattern on the charts is anything to go by.

USD/HKD Forecast
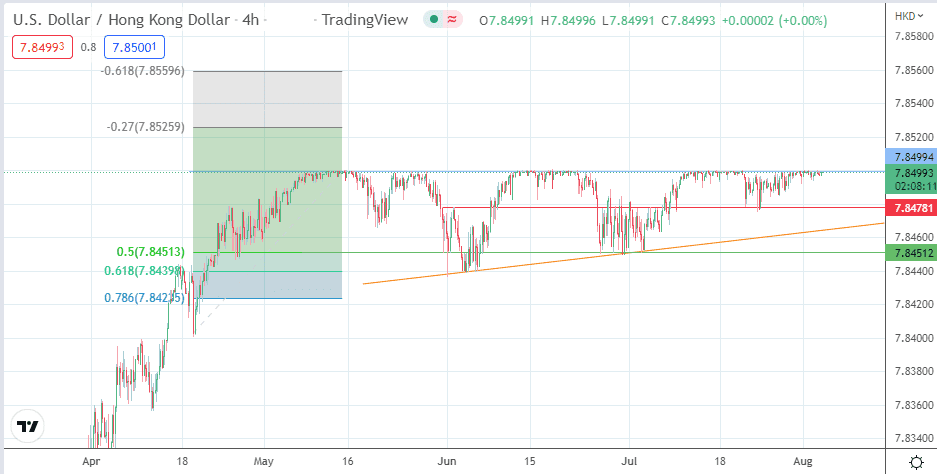
The Fibonacci retracement levels traced by the price swing from the 19 April low to the 15 May high indicate the potential upside targets for the USD/HKD if the bulls can break above the current price ceiling, which also serves as the upper border of the evolving ascending triangle pattern. The initial target could be the 27% Fibonacci extension at 7.85259. Above this level, a continued advance in pursuit of the measured move may be seen at the 7.85596 price mark, formed by the 61.8% Fibonacci extension level.
This outlook is negated if the bears resist attempts at a breakout with rejection and a pullback move from the range’s ceiling. The 10 July/22 July 2022 lows at 7.84781 form the initial downside target. If the bears force a breakdown at this point, the 50% Fibonacci extension level at 7.84512 becomes the next downside target. This point also houses prior lows of 27 June to 4 July 2022. Additional downside targets are seen at the 7.84398 support level (61.8% Fibonacci retracement and 3-6 June lows) and at the 11 April high/19 April 2022 low at 7.84000.
USD/HKD: 4-hour Chart