

- The USD/CAD is down as rising crude oil prices support the Loonie. However, economic data later on could set the tone for the pair this week.
The USD/CAD pair has surrendered all its earlier gains of the day and now trades a tad lower after rising crude oil prices provided intraday support to the commodity-linked Loonie at the expense of the greenback.
The pair had surged 0.81% on Friday after the US Dollar gained traction from hawkish remarks by Fed Chair Jerome Powell in his speech at the Jackson Hole symposium. The greenback picked up from Friday’s bullish close and extended these gains briefly. However, the bullish fundamentals in the crude oil market, which sent the Brent crude price up by 1.72% on Monday, have enabled the pair to retreat from intraday highs.
The USD/CAD could see some heavy action this week, as there is a slightly busy docket of economic data, mainly from the US side. The CB Consumer Confidence comes up on Tuesday, with economists projecting an improvement in the US consumer confidence index from 95.7 to 97.4. The US ISM Manufacturing PMI data comes up on Thursday, and Friday’s Non-Farm Payrolls report caps the show.
Friday’s NFP report will not be released with that of Canada, as has been the case a few times this year. Instead, Canada’s employment report will be released on 9 September, two days after the Bank of Canada (BoC) will make its interest rate decision known.
USD/CAD Forecast
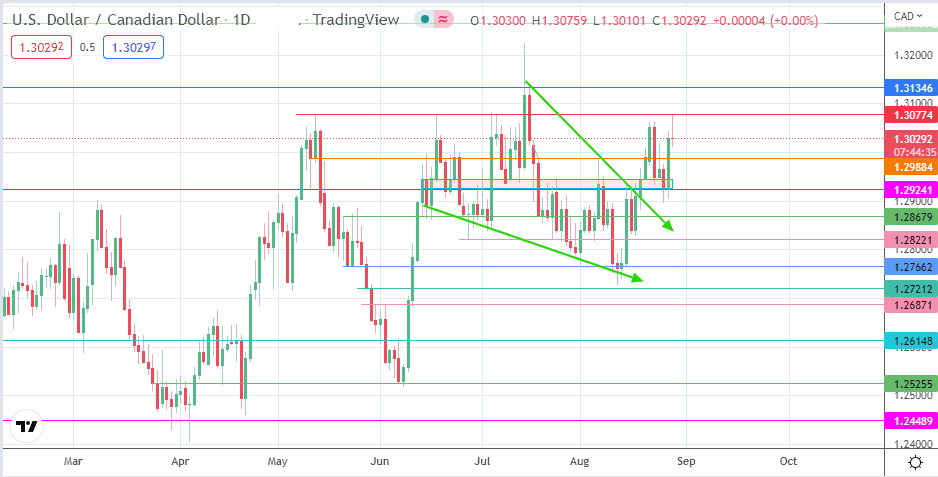
The earlier gains made by the greenback have given way to losses, with the active daily candle now forming a shooting star pattern after being rejected at 1.30774 (12 May and 17 June 2022 highs). A retreat from this level will contest with 1.29884 (21 June and 5 August highs) before the previous support zone enters the picture a successful break of that level.

1.29241 is the floor of the previous supply zone, and if the bears take this level out, the correction will continue toward 1.28679 (14 June low and 28 July high). The 1.27662 and 1.28221 price marks are the previous lows that form the lower border of the falling wedge pattern. They become the new southbound targets if the bulls fail to defend 1.28679.
On the flip side, the continuation of the breakout move would depend on the clearance of the 1.30774 resistance (12 May, 17 June and 5 July highs). This would clear the way for completing the measured move from the falling wedge at the 1.31346 resistance, formed by the previous high of 15 July. There are additional targets to the north at the 14 July peak (1.32237) and the 1.32655 price mark, the site of prior highs of 17 August 2020 and 8 October 2020.
USD/CAD: Daily Chart