- The USD/CAD is down for a third day in a row, but recent price action seems to suggest the downside move is stalling and has lost momentum.
The USD/CAD is down 0.25% this Tuesday and appears on course to make it three straight losing sessions as the broad-based weakness of the greenback continues. As a result, markets have been in the mood for riskier assets this week, as traders who were long on the greenback banked profits.
The Loonie had gained considerable strength versus the US Dollar on the back of an aggressive rate hike by the Bank of Canada on 13 July. The BoC raised interest rates from 1.50% to 2.50%, exceeding the 75bps market expectation as the bank seeks to combat inflation in Canada. Monday’s 4.82% gain in crude oil price also boosted the commodity-linked Canadian Dollar after Saudi Arabia refused to yield to calls by US President Joe Biden to raise production to curb sky-high gasoline prices.
The scenario has allowed the USD/CAD bears to profit from the 175-pip downside move acquired since 15 July. However, this downside move will face pressure from the pullback in crude oil prices and next week’s FOMC decision which could see the Fed matching the BoC’s rate hike.
USD/CAD Forecast
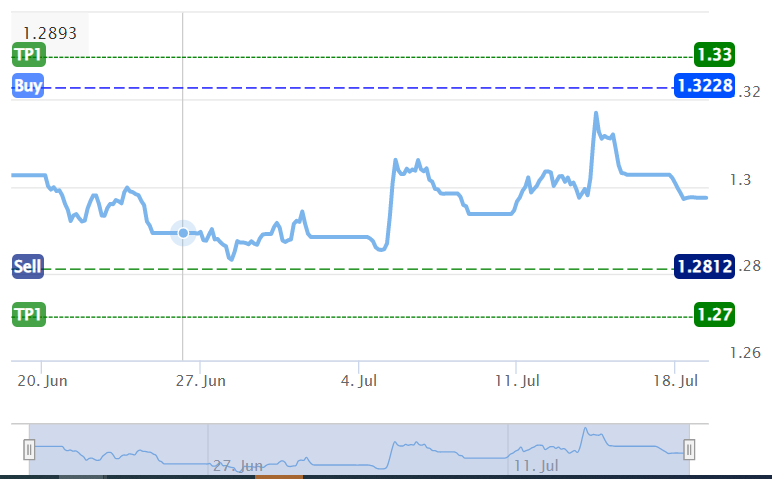
Trades that seek to benefit from the expectation of upcoming USD strength on the back of the FOMC decision would look to the Investingcube S-R indicator, which has set the 1.3228 price mark as the long entry point. This would be more of a Buy Stop order, as it seeks to benefit from another round of CAD strength. This entry would require the bulls to break sequential resistance barriers at the 1.29884 (15 June high) and 1.30774 (6 July high) price levels, along with the 15 July high at 1.31346. The 14 July high at 1.3223 would also have to go for this move to play out.

The first target for a profitable entry is the 1.33000 psychological resistance, where the 4 November 2020 low is sited. The additional price marks not captured by the indicator are at 1.34297 (29 September 2020 high) and 1.34997 (10 July 2020 low).
On the other hand, a breakdown of the 1.29241 support (11 May low) allows the bears to target the 1.28679 support level (14 June/30 June low). This target needs to give way before the S-R indicator’s entry at 1.2812 comes alive. The 1.27419 pivot and the 1.26477 support (27 January and 30 May 2022 lows) enter the mix as additional downside target. Finally, the 1.25964 price mark (6 June high) comes alive on further price deterioration.
USD/CAD Chart