The Unilever share price is down 0.31% on the day after the price faced rejection at the 3626.5 resistance level. This follows three days of a muted upside move that took the stock from 3549.5 to that resistance level.
The downside move is part of a recent correction the stock has seen. The current selling seen on the Unilever share price follows comments attributed to the company’s CEO, who said he did not know how the company would meet its net-zero carbon targets. The company’s products are used as cosmetics, cooking, and household cleaning, activities that CEO Alan Jope says contribute 60% of the company’s total carbon footprint. Jope also said the footprint from its production facilities and logistics network is negligible.
These statements have left investors wondering how the company intends to lower its carbon emissions. Would the company be forced to stop production of some of its best-selling items, or would there be another yet-unknown approach to achieving Unilever’s net-zero targets?
Unilever Share Price Outlook
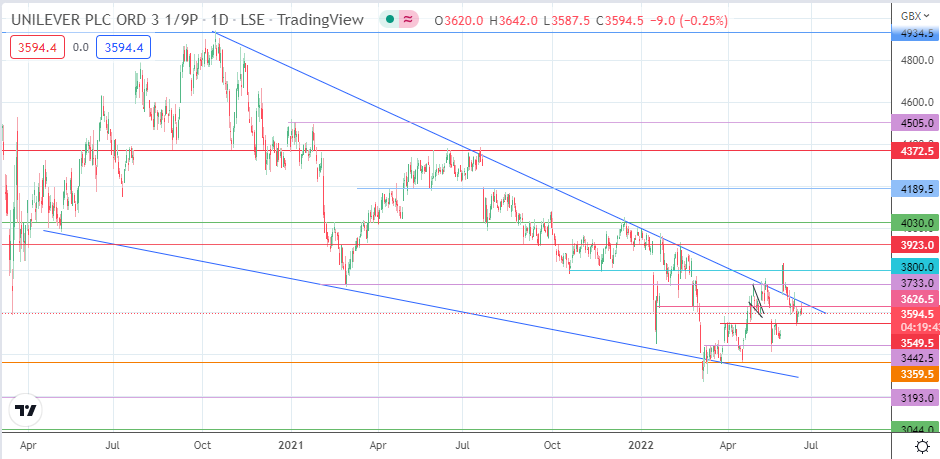
The 3626.5 resistance level intersects the upper edge of the falling wedge on the daily chart and looks vulnerable. A clearance of this level starts the breakout move. The measured move from the pattern’s break
has a wide range to cover to attain completion at 4372.5. The completion of this move will depend on the bulls clearing the previous high of 12 May at 3733.00 and the 3800.00 psychological resistance level (31 May 2022 high). In addition, the 3923.0 (11 February high), 4030.0 (8 September 2021 and 13 December 2021 highs), and 4189.5 (22 July 2021 high) price marks must also give way.
On the other hand, rejection at the 3626.5 resistance leads to a pullback, targeting 3549.5 initially (17 June low). Additional targets to the south include 3442.5 and 3359.5 (19 April 2022 low). Only a breakdown of the latter will degrade the wedge’s lower border, invalidating the pattern and clearing the pathway toward the 3193.0 support (2 February 2017 low). The 19 May 2016 low at 3044.0 rounds off potential short-term targets to the south.
Unilever: Daily Chart