


Published on . Prices and market conditions may have changed since then.
- The Tron price is consolidating above the long-term momentum indictor as nervous traders eye Bitcoin's reversal.
The Tron price consolidates above the long-term momentum indictor as nervous traders eye Bitcoin’s reversal.
Tron (TRX) is treading water at $0.085 (-0.5%) in early Friday trading, down almost 7% this week and -12% month-to-date. This week’s weakness extends the loss to -35% from November’s high and -55% from the April all-time high. There are currently 101.88 billion TRX coins in circulation, which gives Tron a market cap of $8.64 billion, ranking it the 24th-largest cryptocurrency behind Algorand.
The cryptocurrency is on the edge of its seat this morning as Bitcoin sags lower. BTC has lost around 6% in the last two-day, which, although relatively small, suggests the bull market is now behind us. Subsequently, altcoins are experiencing widespread liquidations, forcing many to break down technically.

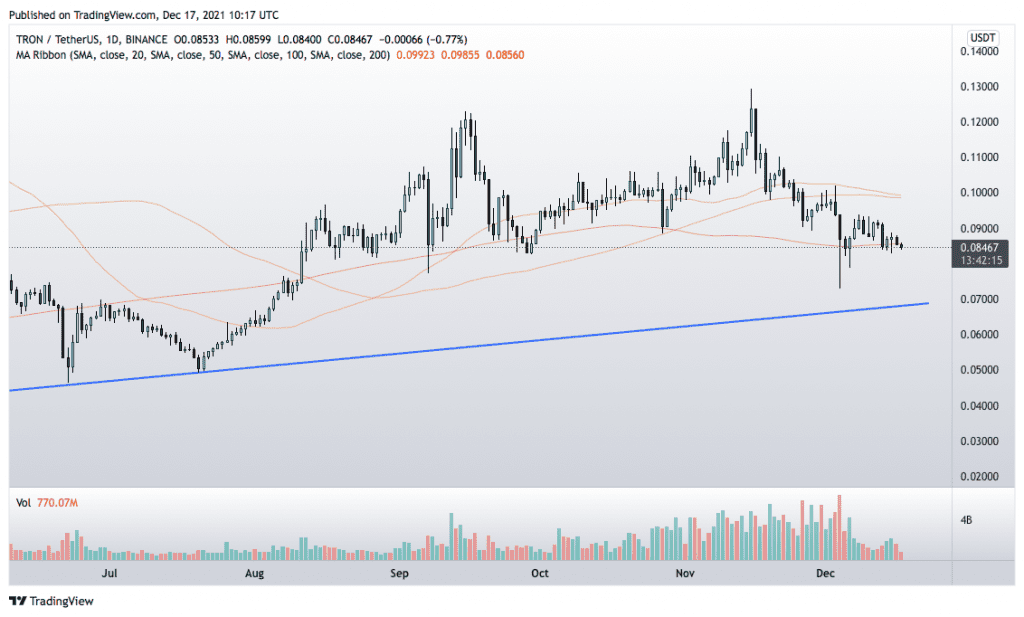
The Tron price is holding up relatively well and remains in a long-term uptrend. However, the immediate danger is a confirmed breakdown below the 200-DMA.
TRX Price Forecast
The daily chart shows that TRX has spent the last two weeks grappling with the long-term indicator, and the support is holding so far. However, in my opinion, BTC’s weakness should eventually force the Tron price lower.
If TRX breaks down, a logical price target is the rising trend line support $0.06810, around 20% below the current price. In contrast, a sharp decline for Bitcoin could cause TRX to over-extend towards the July lows around $0.0500.
Conversely, if Bitcoin recovers and finds strength, Trn should do the same. AIn that event, the bearish sentiment will flip to bullish if the price clears last weeks highs. Therefore, a daily close above $0.9381 invalidates the bearish view.
TRON Price Chart (Daily)
For more market insights, follow Elliott on Twitter.