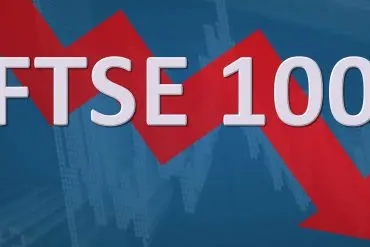
The FTSE 100 index turned red on Thursday as the UK stocks slipped after three consecutive green sessions. The benchmark index stood at 7,422 points in the final hour of trading after opening at around 7,486. This drop comes from a major technical zone, which I will mention later. Earlier this week, the CPI data for October revealed that the UK inflation in slowing down after a rapid...
Random
FTSE 100
In this section, you will find important FTSE 100 news, actionable trading ideas, and a live FTSE 100 CFD chart to help you understand the markets better.
What is the FTSE 100 index?
The Financial Times Stock Exchange 100 Index (FTSE 100), is a stock index of the 100 companies with the highest market capitalisation listed on LSE. The Financial Times Stock Exchange 100 companies represent about 81% of the entire London Stock Exchange market capitalisation.
Component companies must meet a number of criteria set out by the FTSE Group, including having a full listing on the LSE with a Euro or Sterling denominated price on the electronic platform, and meeting certain criteria on free float, nationality, and liquidity.
The FTSE 100 index began with a base level of 1000, on January 3, 1984. The index hit the highest closing value of 7,877.45 on 22 May 2018. Institutional investors use the FTSE 100 as a benchmark of global growth and economic and international events.