


- The Sandbox price is trading within a narrowing channel, indicating SAND may soon experience explosive price-action.
The Sandbox price is trading within a narrowing channel, indicating SAND may soon experience explosive price-action.
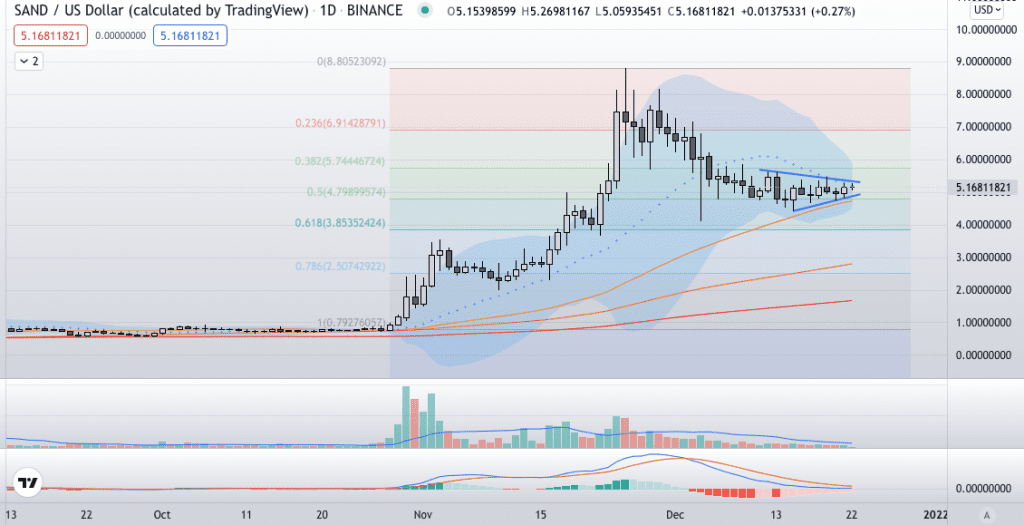
The Sandbox (SAND) has spent the last two weeks snaking sideways around the 50% retracement level of the November rally. Furthermore, the highs are getting lower, and the lows, higher, which considering the previous volatility, is likely to change soon. Like many Metaverse-related Tokens, SAND was one of the best performing cryptocurrencies in November. From Oct 28th through Nov Nov 25th, the token increased 11x from $0.80 to $8.80, lifting the gaming and NFT project’s market cap to $7.5 billion. However, the price has ebbed lower over the last month, as has most of the market. As a result, SAND has given back half the gains and is currently trading just above $5.00.
SAND Price Forecast
The daily chart shows The Sandbox price is constricting in a narrowing triangle pattern, which often predicts a sudden breakout.
The 50-DMA at $4.71, and the 50% Fibonacci retracement level of $4.79, reinforce the triangle’s lower edge at $4.88. Therefore, the support is stronger than the resistance of the upper edge at $5.27. Successful clearance of $5.27 (on a closing basis) should spark a move higher toward $7.00.
On the other hand, if SAND breaks down below the 50-DMA, it could extend down to the 100-DMA at $2.80.

An upside extension looks the likeliest scenario considering the confluent support, although anything is possible in the current climate. For that reason, traders should prepare for either eventuality.
The Sandbox Price Chart (Daily)
For more market insights, follow Elliott on Twitter.