- A clearance of the resistance at 15.113 leads to additional price recovery, validating bullish Tellor price predictions.
The 13.38% decline on the day appears to have truncated recent bullish Tellor price predictions. The TBR/USDT pair was coming off a 4-day winning streak that was capped off by a robust 40.10 price gain on Monday. Attempts to breach the previous highs of 10 May 2022 at 15.11353209 failed, as the bears quickly forced price action back to the immediate support.
Coming from all-time highs of 79.31 on 13 November, just before the Omicron scare shook the crypto markets, the pair plunged to new lows on 27 May 2022 after taking out the previous all-time low of 6 October 2020. As a result, the price is just 13% of what it used to be in mid-November.
Without any fundamental triggers, any bullish Tellor price predictions will pin their hopes on the emerging falling wedge pattern. Tuesday’s pullback move is an attempt at the price action to return to its origin, which is a common occurrence.

The wedge’s upper border has been violated, and a critical resistance at 8.36928193, turning this price level into support. However, restoration of the recovery depends on the bulls forcing a bounce at this point. This must be followed by a clearance of the next available resistance to validate bullish Tellor price predictions.
Tellor Price Prediction
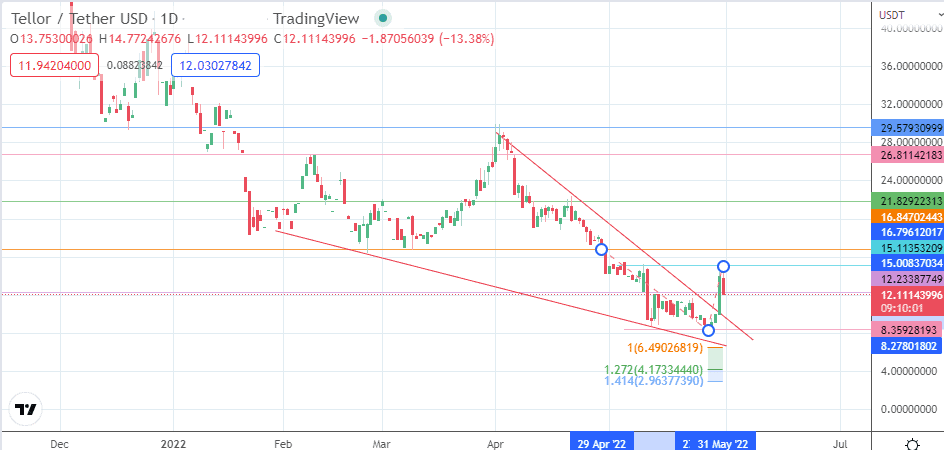
The large falling wedge on the daily chart of the TRB/USDT pair points to a measured move that targets 26.81142183. To achieve this level, the bulls must initiate a bounce from the current support at 12.23387749. This bounce must translate into an advance that takes out 16.84702443 (10 March low and 30 April high), along with 21.82922313 (25 March and 20 April highs).
On the flip side, a decline below the 12.23387749 support opens the door toward the 8.35928193 support level. The pair tumbles to new record lows if this new support breaks down. The Fibonacci extension levels may serve as the potential pivots to arrest the slide, with 6.49026819 and 4.17334440 (127.2% extension level) serving as the immediate candidates to form new support levels.
TRB/USDT: Daily Chart