Archived Article This article was published more than 5 months ago. The market data, prices, forecasts, and analysis were accurate at the time of publication but may have changed since then. Please use this article for historical reference only and refer to our latest content for current market information.
- The S&P500 was looking to move higher at the U.S. open despite jobs data showing a slight increase in jobless claims. The weekly number 0.27% higher.
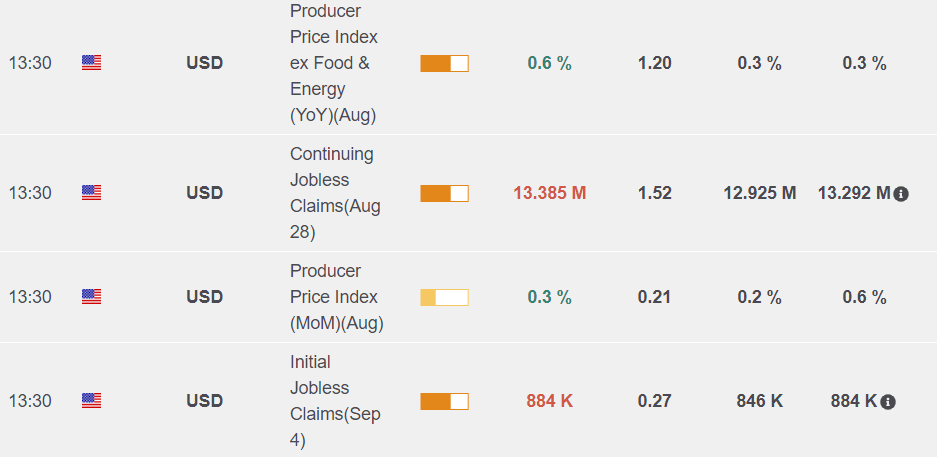
The S&P500 was looking to move higher at the U.S. open despite jobs data showing a slight increase in jobless claims. The weekly number to September 4th was 0.27% higher, while the rolling number was still stubborn at 13.38 million claiming unemployment benefits.

The economic calendar also saw the release of inflation data with producer prices higher than expected. The index (ex food and energy) was 0.6% higher, while the monthly figure for August was 0.3% higher with expectations of 0.2%.
Producer Prices and Jobless Claims
Tomorrow will see a more important indicator of inflation with the core CPI release. Analysts are expecting numbers of 1.2% and 1.6%. The Federal Reserve was clear about its desire to target a 2% inflation number. If the numbers came in higher than expected then markets may have to re-price the idea of Fed stimulus. A stronger pace of recovery would require less money market intervention and could see stocks mount a stronger correction.
Veteran Hedge Fund investor Stan Druckenmiller told CNBC yesterday that he saw inflation running to 10% in the long-term and also saw stocks in, ‘an absolute raging mania’. His comments were related to price action seen in the 2000 U.S. tech stock bubble that eventually deflated.
S&P500 Technical Outlook
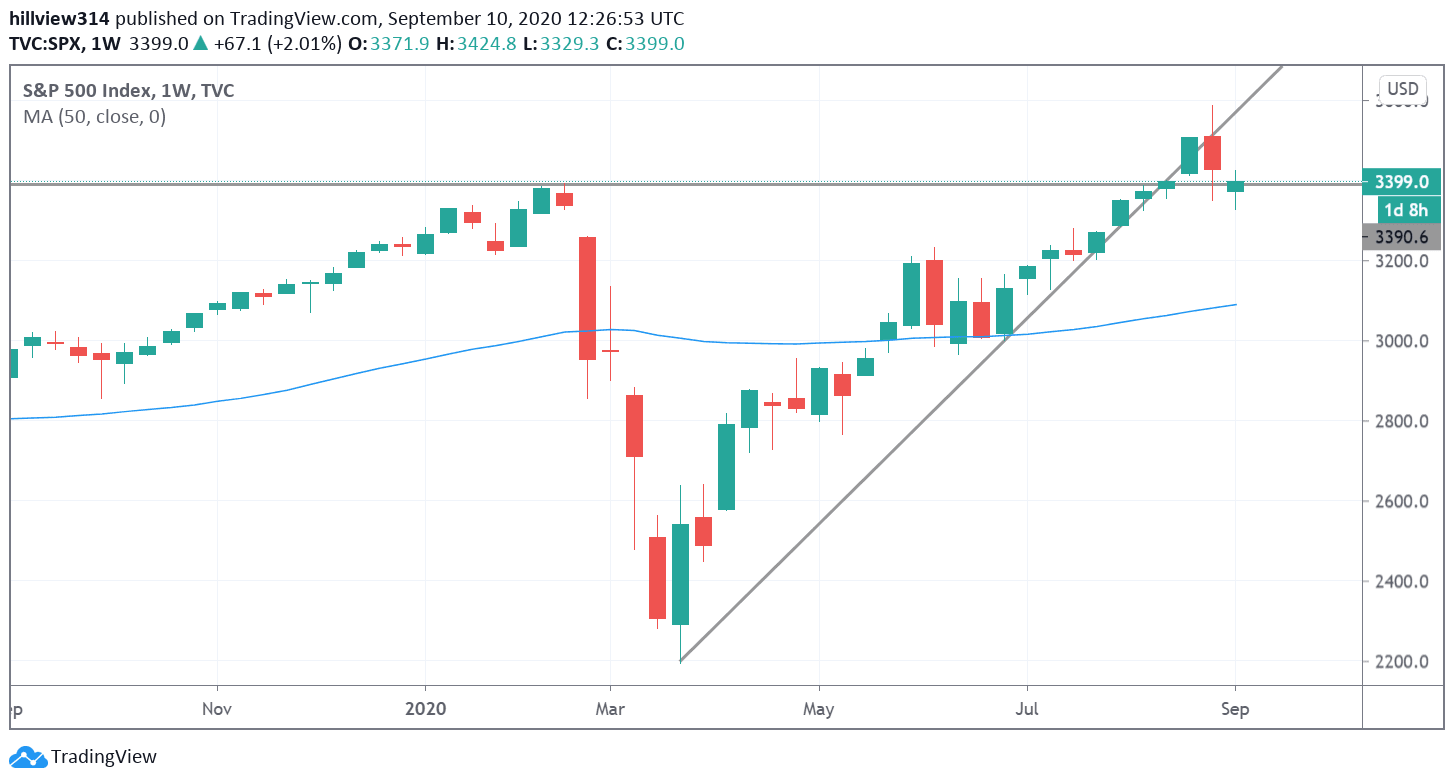
The S&P500 was 2% higher today and testing the 3400 level again but this is a key resistance level. The weekly chart highlights that last week was a bearish engulfing bar and there is downside risk to the 50 day moving average near 3100. Support also exists at the 3000 level. A close higher today could target last week’s high but this is maybe a dangerous place to go long. The Investing Cube team is now available for one-to-one coaching in the markets. Please see details here.
S&P500 Weekly Chart