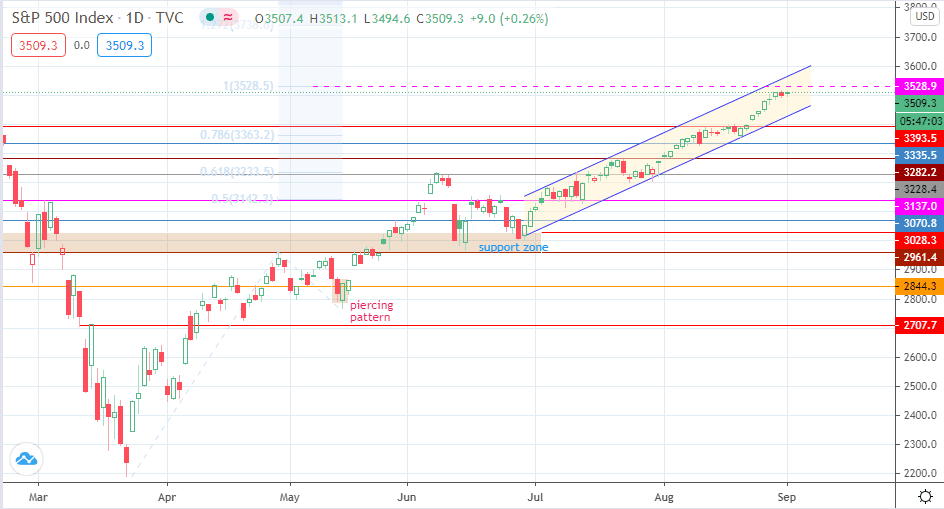
- S&P 500 index responds positively to the upbeat US ISM Manufacturing PMI data, but in very low volumes as buyers continue to drive price action.
The S&P 500 opened for Tuesday’s trading session in the red, down by 3.7 points at 3497.0 as it picked up from yesterday’s lower close. The S&P 500 closed at 3500.3, after a lacklustre end to what has been its 2nd best performing month in 2020. However, buyers seem to have come into the fray after the first 15 minutes of trading. They are now dictating price action but without much conviction. If the S&P 500 is to post higher highs towards 3600, buying volumes would have to increase beyond present levels.
It also seems that the outcome of the US ISM Manufacturing PMI number is now driving immediate price action on the S&P 500. The data release shows an increase from July’s 54.2 to a healthy 56.0 in August. The S&P 500 is now trading 0.29% higher at 3510.5 as at the time of writing.
Technical Outlook for S&P 500
The ascending channel continues to act as the containing factor for price action, with the price still on the pathway towards the upper channel border. However, any further upside move has to take out the potential resistance at 3528.9, which is formed by the 100% Fibonacci extension from the price swing of 23 March to 29 April. Only when this resistance gives way can price have room to hit the channel’s return line.
On the flip side, a rejection at that resistance level could prime the S&P 500 for a pullback, which makes 3393.5 a logical but fast disappearing support target. As it is, only a channel breakdown would permit this move from coming to pass. Additional support targets at 3333.5 and 3282.2 will also benefit from such a breakdown if the decline is more extensive.

S&P 500 Daily Chart