After posting its best weekly gains in 2023, the S&P index, along with other Wall Street indices, opened higher on Monday as the markets expected no further rate hikes. A soft job data released last Friday further supported the notion that the Fed is done increasing interest rates in for the current cycle.
According to the CME FedWatch tool, there is a 90% chance of the Fed to maintain the interest rates between 5.25%-5.50% in its December meeting. In addition, the easing of rates may begin as far as May of 2024.
The investors now await the speeches by policymakers, which are lined up this week, to guess their intentions for next year.
The S&P 500 index kicked off the week by gaining 7 points on Monday, while the Nasdaq and Dow Jones added 184 and 45 points, respectively. These indices were bolstered by the gains experienced by the energy, health, and tech sectors.
The market sentiment seems to be improving as Uber, Carlyle, KKR, Walt Disney, and MGM are expected to post their quarterly results this week.
The US 10-year treasury yield is now well below the 5% mark as the weak non-farm payroll data and weak PMI figures for the month of October point towards a slowdown in the US economy. This has led traders to believe that the Fed should adopt a more dovish approach in its interest rate policy.
S&P 500 Index Forecast
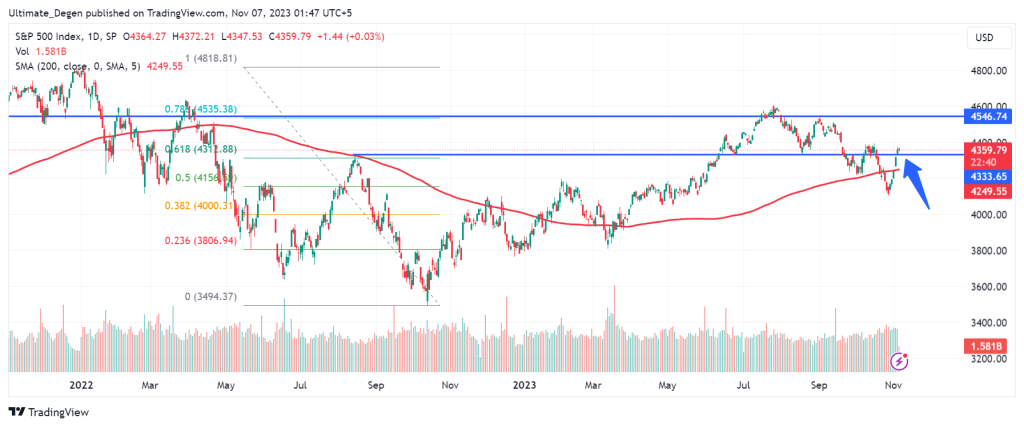
The S&P 500 Index was able to reclaim the 4333 points level last week aided by the strong bullish momentum. The next step for the index is to confirm this breakout by retesting the key level for support. This recovery rally could be attributed to a major pullback in the bond yields.
In case the bulls are successful in flipping the 4,333 points level into support, the index is poised to rally 4.3% toward the 4,550 points resistance level. However, a break below 4333 points will put a retest of the 200 MA level, which lies at the 4250 points level, on the cards.
SPX Chart