Shiba Inu price has hit a strong wall as the recent recovery pauses. The token was trading at $0.000011, where it has been stuck at in the past few days. This price is a few points above last month’s low of $0.0000077. The next important catalysts for the SHIB/USD price will be the upcoming Shibarium beta launch and the decision by the Federal Reserve.
Shiba Inu price analysis
SHIB price will next react to the upcoming Fed decision scheduled for Wednesday. Economists believe that the Fed will hike interest rates by 0.25%, the lowest increase in six meetings. It hiked by 0.50% in December after rising by 0.75% in the previous four straight meetings. An extremely hawkish tone will likely be bearish for the SHIB price.
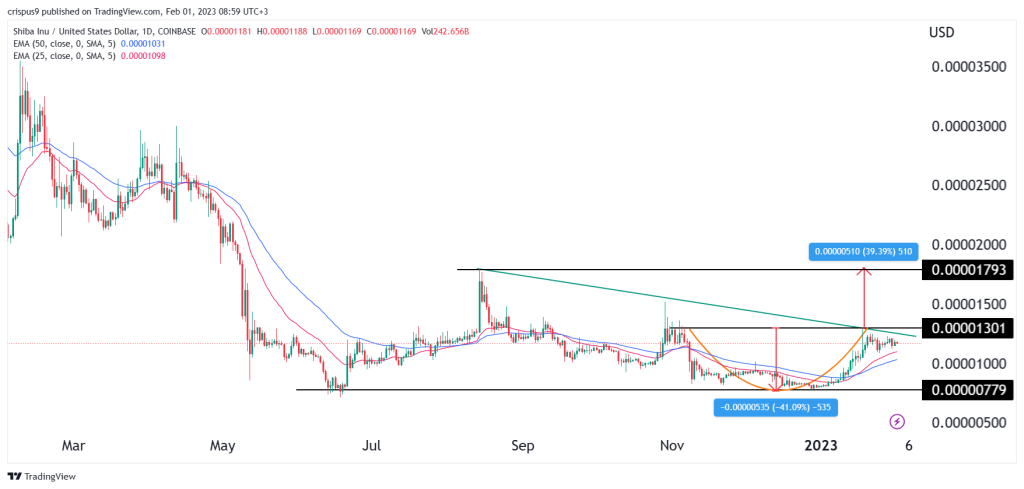
On the daily chart, we see that the Shiba Inu price did not stop where it did in January by accident. It was an important price since it coincided with the falling trendline that is shown in green. This trendline connects the highest point on October 29 and August 14 of last year. Also, the peak at $0.000013 was also the peak on November 5. Therefore, this performance hints that Shiba Inu is still in a broad bearish trend.
Shiba Inu has also found a strong support level at $0.0000077, where it struggled to move below in December and June last year. Most importantly, it has also formed what looks like a cup and handle pattern, which is usually a sign of a bullish continuation.
Therefore, a combination of a cup and handle pattern and the descending trendline means that a bullish breakout will only be confirmed if the price moves above the important resistance level at $0.000013. By measuring the upper side of the cup and handle with the lower side, we can estimate where the coin will rise to in February.
As such, this measurement means that the Shiba Inu price will rise by about 40% in Feb if buyers are successful to move above the resistance at $0.000013. This target of $0.000017 coincides with the highest point on August 14.
SHIB/USD 4H analysis
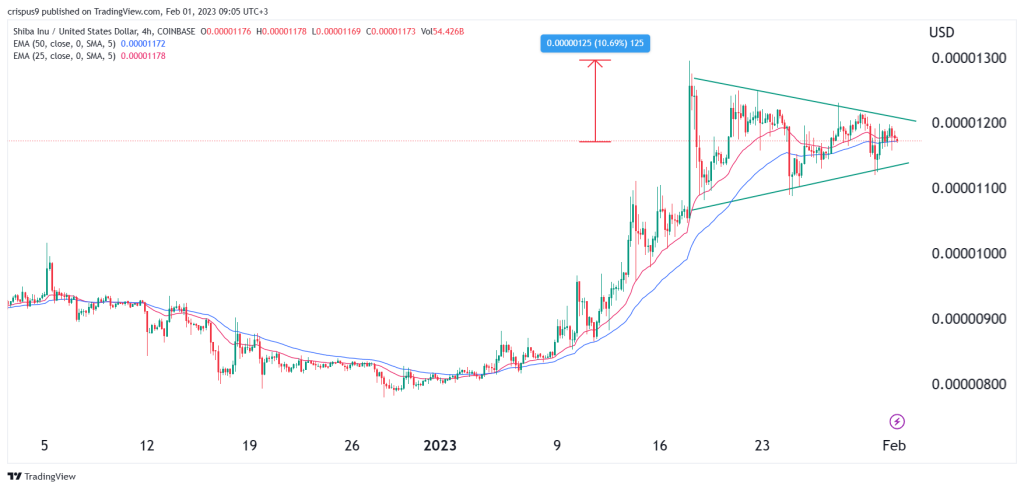
The SHIB/USD price has been consolidating, as you can see on the four-hour chart. As it consolidated, the coin is forming what looks like a bullish pennant pattern that is shown in green. In technical analysis, this pattern is usually one of the most bullish patterns. And as it nears its confluence point, we could see some strong moves soon.
Therefore, if the pennant pattern works out well, there is a likelihood that the token will make a bullish breakout. The initial target of the stock will be at $0.000012, the year-to-date high, which is about 10% above the current level. On the flip side, a drop below the support at $0.000011 will invalidate the bullish view.
Read more: Shiba Inu price prediction for 2023, 2025, and 2050.