
- The Vedanta Power share price is starting to recover as new demand comes into the stock following the post-listing correction.
Current Setup and Live Chart
The Indian government is currently conducting a structural expansion in its critical infrastructure. One of the hallmarks of this expansion is increased investment in electricity generation and distribution, which is a key backbone for companies operating in the power sector, including Vedanta Power.
Vedanta Power started trading on the NSE in mid-June 2026, after the company deleveraged its power division and listed it as a separate entity on the Indian stock exchange. The Vedanta Power share price currently trades at 40.94 as of writing, up 1.5% as new demand enters the stock following the recent post-listing correction.
Macro Drivers for Vedanta Power Share Price
1) Rising Indian Power Demand
India’s electricity demand is growing at one of the fastest rates among emerging economies. The expansion of India’s manufacturing sector, driven by the Modi-led government’s “Make in India” initiative, is a driver of this demand. Furthermore, AI data center development, EV adoption, rising household electricity consumption, and further urbanization in India are additional factors driving demand to record levels. This increase in demand locally has created favorable conditions for power producers like Vedanta Power to thrive.
2) Company Restructuring
Investors continue to focus on the company’s efforts to strengthen its restructuring process fully. The restructuring is meant to reduce the company’s debt, optimize its assets, and drive capital allocation discipline. Headlines and narratives indicating continued progress on refinancing and deleveraging the company’s structure could improve investor confidence, which could, in turn, support attempts to expand valuation.
Vedanta Power Share Price Catalysts
1) Global Risk Sentiment: With the recent escalation in the geopolitical space, global risk sentiment has switched towards risk aversion. This could limit market expectations for Vedanta Power’s earnings in the near term. However, the company’s earnings are driven primarily by local factors such as India’s expanding power demand, making the stock a defensive pick. Therefore, whatever impact this change in sentiment has on Indian markets is not expected to be felt much in Vedanta Power’s share price.

2) Energy Policy: Amid rising power demand, India’s energy policy is expected to be a key price catalyst for the power sector. The market will continue to monitor trends in utility demand and government policies that respond to this demand, including energy infrastructure budgets, power generation capacity, and the supply of coal to power these power plants. The market expects strong demand growth and steady earnings for the company’s operations.
3) Headlines Around Debt Management: Any headlines or updates that dictate the narrative around debt management, asset sales, capital expenditure, refinancing, or indeed any form of corporate restructuring will prove to be a key cross-catalyst in the near and medium term. Positive roadmaps in this regard will lead to increased market confidence, as it reduces financial risk to the company’s operations.
Vedanta Power Forecast Scenarios
Base Case: The Vedanta Power share price remains within consolidation in the near term as the market rebalances post-listing.
Bull case: Strong domestic electricity demand and resilient industrial activity are the key drivers of this scenario. This will be driven by improved cash flow expectations, accelerated debt reduction, and positive headlines about the company’s restructuring, which will boost investor confidence.
Bear case: Weak industrial activity or a headline indicating disappointing progress in restructuring, debt reduction, and other ongoing developments is a trigger for the bear case scenario. If these factors emerge, they will reduce earnings expectations and prompt investors to reassess the company’s current valuation.
Vedanta Power Share Price: Technical Outlook
The price is consolidating within an evolving symmetrical triangle on the 1-hr chart. A break to the upside has to take out the 42.99 resistance to confirm the upside move. This lines up targets at 43.90 (the 15 June high) and 45.30, the prior high from 23 June.
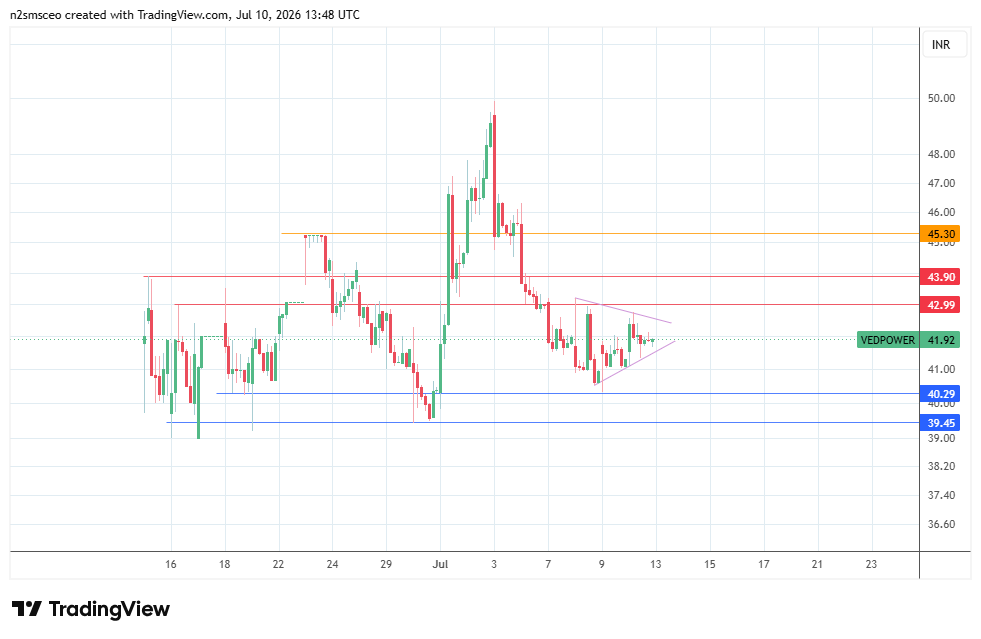
On the flip side, a breakdown of the triangle’s lower boundary targets the 40.29 support (9 July low). If this support fails to hold under downside pressure, the next pivot is at 39.45, the prior low of 30 June.