
The S&P 500 index is extending its selloff into the third day as the tech and energy sectors led a total sectorial collapse on the index. Not even comments by US Senate Majority Leader Mitch McConnell on a new vote by the Republicans in the US Senate was enough to boost investor sentiment. The S&P 500 has dropped more than 2% this Tuesday as risk aversion continues to dominate the US markets.
Risk aversion was enhanced after US President Donald Trump said the US could consider denying federal contracts to companies who outsourced aspects of these contracts to China. The technology index was hardest hit on the S&P 500, shedding 3.5% as at the time of writing on a day that all 11 sectors on the index were trading lower.
Technical Outlook for the S&P 500
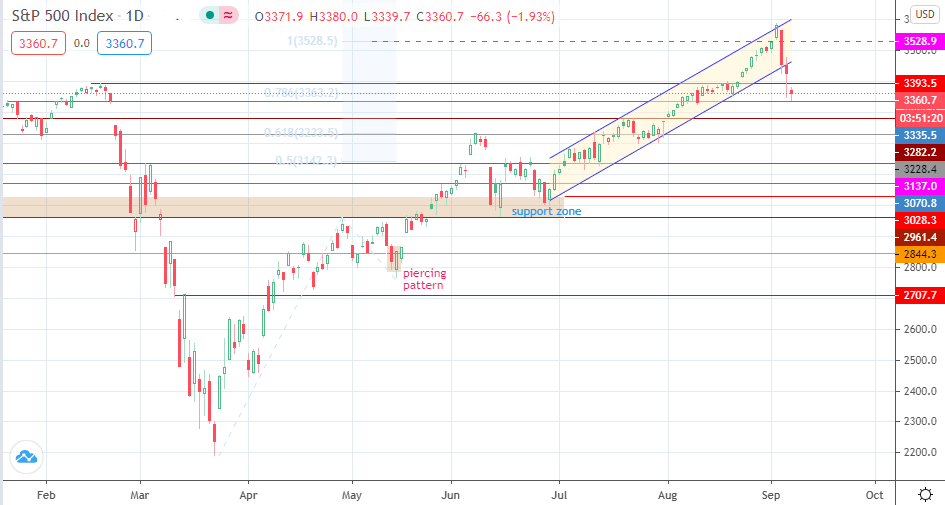
Credit Suisse has indicated that it expects a corrective phase to form below the 3479/3497 price level, as the market had been to the extreme end of the uptrend. The ban has a bias for “more protracted consolidation” within the primary uptrend. On my own part, I tend to agree with aspects of Credit Suisse’s view. The market had been overextended and needed a correction. This correction appears to have found support at the 3335.5 support line, following the breakdown of the ascending channel on Friday.
The index remains under pressure, and if the 3335.5 support buckles under this weight, then 3282.2 becomes the next available support, having been tested on August 7, 10 and 11. 3228.4 also remains valid potential support.
Conversely, a bounce on the 3335.5 area with follow-through buying could mount a recovery attempt that tests the 3393.5 resistance. Above this level, 3528.9 could form a barrier to the retest of the all-time highs seen at 3588.1. Recovery continues beyond this level, as a higher close confirms the higher high required to sustain the uptrend.
Don’t miss a beat! Follow us on Telegram and Twitter.
S&P 500 Daily Chart
More content
- Download our latest quarterly market outlook for our longer-term trade ideas.
- Follow Eno on Twitter.
- Do you enjoy reading our updates? Become a member today and access all restricted content. It is free to join.