
- New headwinds could put additional bearish pressure on Netflix, prompting renewed Netflix stock price forecasts.
Two days of price uptick have given holders of Netflix stock a breather, but this has not shaken off bearish Netflix stock price forecasts. This is because potential headwinds still exist, and the latest of these comes from South Korea, where the government is proposing that Netflix and Google pay local network fees.
South Korean lawmakers recently introduced legislation which would impose a network fee on the affected companies. The legislation remains in its early stages but is gaining traction in the parliament after a parliamentary hearing revealed that Netflix was not paying the same network fees which similar local firms were doing. A local provider, SK Broadband, is already attempting to collect these fees, prompting a lawsuit from Netflix.
The Netflix stock price forecast remains bearish as the stock appears not to have shaken off the impact the loss of its subscriber base to its competition across the world has had on the recent share price activity. Nevertheless, the stock is up 0.64% on the day, adding to Monday’s 4.78% gain following the arrest of the descent at the 189.81 support level.
Netflix Stock Price Forecast
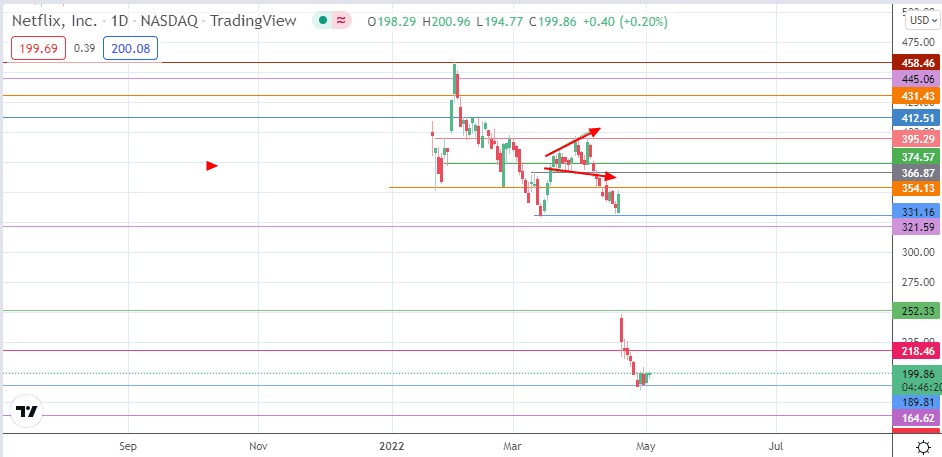
Following the conclusion of the megaphone top and the huge bearish gap, the price activity was able to find support at the 189.81 price mark (26 July and 27 September 2017 double top and 10 November 2017 support).
If bullish momentum increases, the 218.46 price mark becomes the initial upside target for the recovery move. 252.33 (20 November 2018/26 September 2019 highs) and 275.27 (2 April 2018/30 October 2018 lows) are additional price targets north of this barrier. Attainment of the 331.16 resistance covers the bearish gap, but this move has to take out 275.27 and 321.59 (2 January 2020 low) to become a reality.

Conversely, resumption of selling pressure follows a breakdown of 189.81. The breakdown of this support paves the way for a push lower towards 164.62 (29 August 2017 low). Below this level, additional support is found at 147.01, which is the site of a former low seen on 7 July 2017.
Netflix: Daily Chart