
- The chart indicates that the bulls will have a struggle to stop the bears from breaking down the 12400 psychological support.
Following Friday’s huge decline, the Nasdaq 100 index has opened the new week on a positive note, gaining 0.41% in the first fifteen minutes of trading. The Nasdaq 100 index was forced to shed 4.46% on Friday after Fed Chair Jerome Powell threw the door open for an aggressive rate hike in its September meeting following hawkish comments at the Jackson Hole symposium.
This decline wiped off the gains of the previous two days and set a bearish situation on the charts. Rate hikes are usually bad for the stock markets, as they drive investment flows into the bond market and also make it more expensive to secure margin capital to trade.
From the standpoint of technical analysis, the price action of the last few weeks have formed a head and shoulders pattern, which could have bearish connotations if the ascending trendline that connects the recent lows collapses under bearish momentum.
Nasdaq 100 Index Forecast
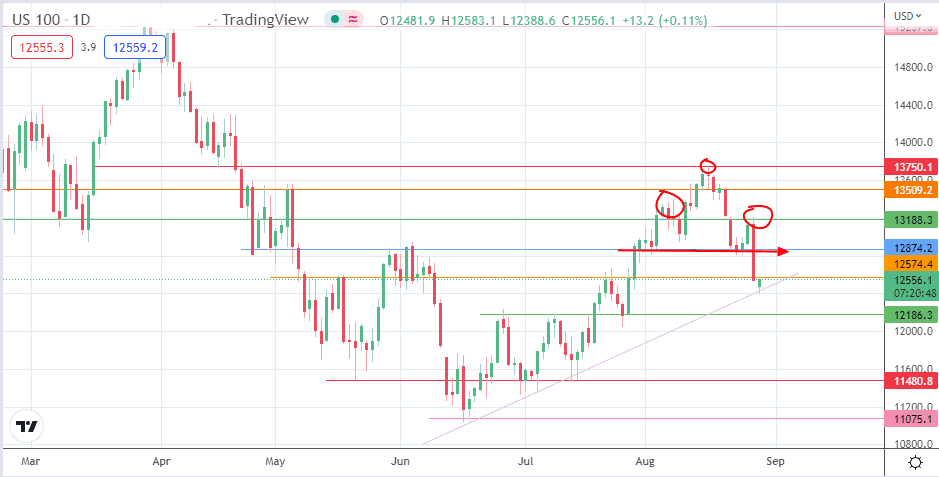
The head and shoulders pattern was completed by Friday’s downside break of the neckline at 12874 (8 August and 22 August lows). The breakdown move has extended downwards with a violation of the 12574 support. However, the bulls were able to hold off a further decline at the 12400 psychological support level.

This price level also features an intersection by the ascending trendline support, from which the price action bounced. This bounce has been capped at 12574. Completing the measured move of the head and shoulders pattern at the 12000 psychological price mark (12/15 July highs) must follow a breakdown of this trendline and the 12186 support (8 July high and 27 July low).
On the flip side, a clearance of the 12574 resistance puts off this outlook. Instead, it creates a pathway for the bulls to aim for a rally toward 12874. If the bulls clear this barrier, the 13188 resistance (22/26 August highs) and the 13509 barrier (19 August top) form additional price targets to the north. The peak of the doji candle of 16 August at 13750, which forms the head, only becomes viable if 13509 is breached.
Nasdaq 100: Daily Chart