
- The Nasdaq 100 index has risen sharply in the past few days as the earnings season continues and the VIX index drops sharply.
The Nasdaq 100 index has risen sharply in the past few days as the earnings season continues. The tech-heavy index rose to a high of $12,400, which was the highest level since June 9th of this year. In addition, it has jumped by almost 13% from its lowest level this year as the VIX index has tumbled to the lowest level since June 8th.
Has the Nasdaq sell-off bottomed?
The Nasdaq 100 index has risen sharply in the past few days for several reasons. First, investors have scaled down their Fed hikes expectations. After predicting that the bank will hike interest rates by 100 basis points last week, most analysts believe that the bank will hike by 0.75% next week.
Tech-heavy stocks tend to do in a period when the Fed is less hawkish. This also explains why the US dollar index has pulled back from last week’s high of $109 to $106. It also explains why cryptocurrencies like Bitcoin and Ethereum have rallied recently.
The Nasdaq 100 index has also rallied because of the falling volatility. The closely-watched VIX index has crashed to the lowest point in more than a month. Similarly, the fear and greed index has moved from the extreme fear level to the current 35.
Third, the index has rebounded as the earnings season continued. On Wednesday, Tesla published relatively strong results considering that it shut down its plants in China in Q2. The firm delivered a profit of $2.3 billion in the quarter. This was better than expected but lower than the $3.3 billion it reported in Q1. Its revenue dropped slightly to over $16.6 billion.

Finally, the Nasdaq 100 index has recovered because there are signs that inflation is starting to ease. For example, recent data shows that most commodities have seen their prices decline sharply in the past few months. In addition, ocean shipping costs have also pulled back in the most recent past.
Nasdaq 100 forecast
The four-hour chart shows that the Nasdaq 100 index has been in a strong bullish trend in the past few days. It has managed to move above the upper side of the falling channel pattern that is shown in blue. The index has also risen above the 25-day and 50-day moving averages, while the Relative Strength Index (RSI) has moved to the overbought level.
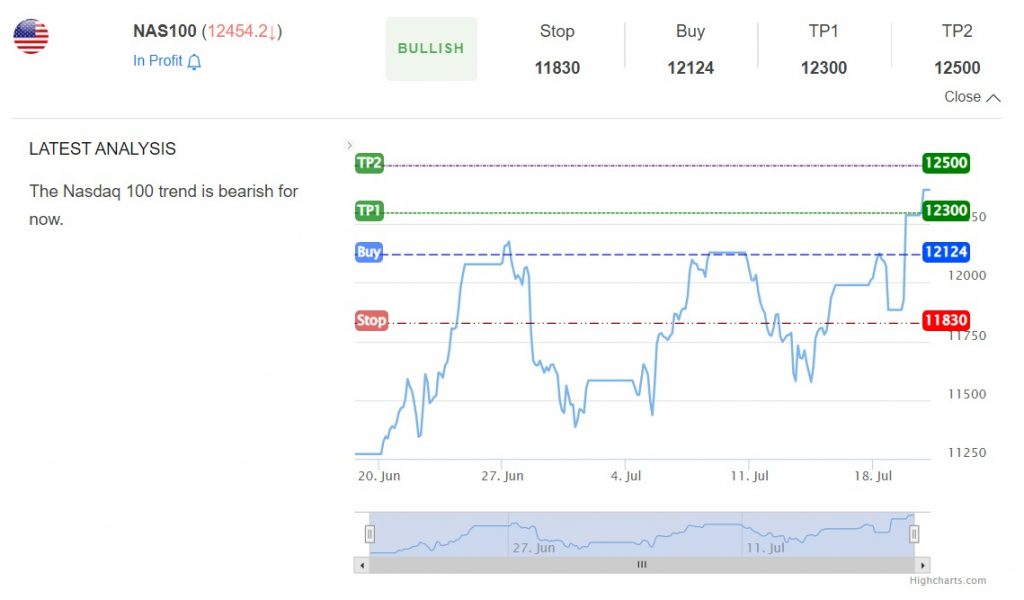
The index will likely keep rising as investors target the next key resistance level at $13,000. However, before this happens, there is a likelihood that it will retest the upper side of the channel at about $11,800. This view is consistent with InvestingCube’s S&R indicator, to which you can subscribe for accurate signals.