
- With the Nasdaq 100 index falling, should you sell in May and go away? We explain whether it makes sense and what to expect.
The Nasdaq 100 index has moved sideways in the past few days as investors refocus on the ongoing earnings, rising bond yields, and the upcoming Fed meeting. It is trading at $13,090, which is slightly above the lowest level last week. However, it has still crashed by over 22% from its highest point this year, meaning that it is in a bear territory.
The quarterly earnings season has been going on recently. In most cases, many tech companies have published mixed results. For example, tech companies like Amazon, Netflix, and Teladoc published extremely weak results while PayPal and Meta Platforms had encouraging ones. This week, the earnings season is going on with well-known companies like Biogen, Molson Coors, and S&P Global expected to publish. According to FactSet, companies have had the weakest earnings growth in years.
The Nasdaq 100 index will react to the upcoming interest rate decision by the Federal Reserve. The bank is expected to sound a bit hawkish like the Relative Strength Index (RSI). For example, they expect that it will hike interest rates and then start implementing the quantitative easing policy.
Ahead of the decision, the closely watched fear and greed index is stuck at the fear level of 33. At the same time, some investors are using the concept of “sell in May and go away”. It means that people should dump their assets in May since the stock market tends to underperform in this period. Still, a closer look at the data shows that it does not work well.

Nasdaq 100 forecast
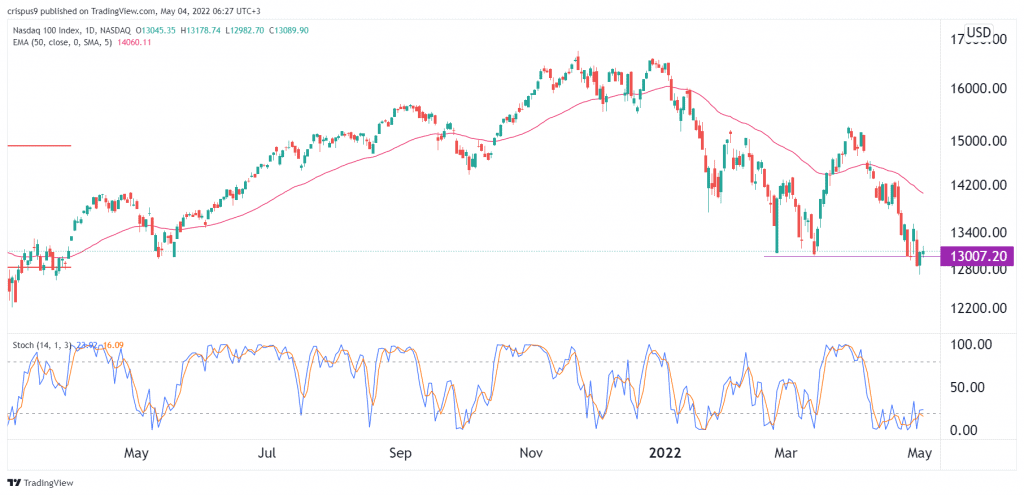
The four-hour chart shows that the Nasdaq 100 index has stabilised this week. It has formed what looks like a double-bottom pattern, which is a sign that it could be bottoming. However, the index remains stuck at the important support at $13,000 and below the 25-day and 50-day moving averages. In addition, the Stochastic Oscillator has moved below the oversold level.
Therefore, a drop below last week’s low at $12,800 means that bears have prevailed and that the double-top pattern has been invalidated. If this happens, the next key support level to watch will be at $12,500.