
What Is Fibonacci Retracement?
Fibonacci retracement is a tool traders use to identify potential support and resistance levels in the market. Typically, these are price levels where an asset might pause, bounce back, or reverse during its movement—either after going up or down.
The idea itself does not have its origins in trading, but comes from the Fibonacci sequence, a series of numbers that has been known for centuries. It follows the pattern: 0, 1, 1, 2, 3, 5, 8, 13, 21… and so on. Each number is the sum of the two before it. This sequence is replicated in nature, architecture, even the spirals of a seashell, and so traders thought, “why not use it in the financial markets too?”.
The beauty of it is that you don’t need to memorize the sequence. What’s more important are the ratios that come from it. These are percentages like 23.6%, 38.2%, 50%, 61.8%, and 78.6%, and they’re used to predict how far a price might retrace before continuing in its original direction.
A Brief History of Fibonacci Sequence
The sequence was introduced to the world by a guy named Leonardo of Pisa, also known as Fibonacci, in the year 1202 through his book Liber Abaci. But Fibonacci didn’t device this retracement method for trading. That part came much later, as technical analysts and chartists started seeing patterns that these ratios seemed to line up with price action in the markets.
In the 20th century, and traders began using Fibonacci levels to help map out entry and exit points, stops, and price targets.
How to Use Fibonacci Levels on a Chart
Let’s say you’re looking at a chart where a stock jumped from $10 to $15. That $5 jump is a “significant move.” Now, traders expect that the price might pull back a bit before continuing to rise—or even reverse direction. So, they apply Fibonacci retracement to measure potential pullback levels.
You will take that move from $10 (the swing low) to $15 (the swing high) and then apply those key Fibonacci percentages:
- 38.2% retracement = $15 – (0.382 × $5) = $13.09
- 61.8% retracement = $15 – (0.618 × $5) = $11.91
Now, in $13.09 and $11.91, you’ve got potential support levels where buyers might jump back in. Note that these levels are not foolproof. Sometimes they hold strong, sometimes they don’t, but they often give traders a useful heads-up.
Interpretation of Key Fibonacci Levels
Below, we look at what different Fibonacci levels mean:
- 23.6%: This is a shallow retracement, often seen in strong trends.
- 38.2% and 61.8%: These are the “sweet spot” levels many traders focus on. The 61.8% level is also known as the Golden Ratio, and is often considered a strong support or resistance level.
- 50%: Interestingly, this isn’t a Fibonacci ratio, but it’s widely used anyway as a psychological midpoint.
- 78.6%: This is a deeper retracement level, and is typically seen before a complete trend reversal.
How to Use Fibonacci Retracement in Trading
Below is a step-by-step guide on how to use Fibonacci retracement in trading.
Step 1: Identify the Trend
This is critical, as Fibonacci retracement works best when there’s a clear uptrend or downtrend in place. Without a trend, you’re basically applying math to chaos.
- During an, you’ll be looking for pullbacks to enter long (buy) positions.
- During a downtrend, you’ll be keen to spot potential bounce zones to enter short (sell) positions.
Step 2: Draw the Levels

Most trading platforms come with Fibonacci retracement tool. Here’s how you draw it:
- In an uptrend: Click from the lowest point (swing low) to the highest point (swing high).
- In a downtrend: Click from the swing high down to the swing low.
Once you do that, horizontal lines will appear at 23.6%, 38.2%, 50%, 61.8%, and 78.6% marks. These will serve as your potential support and resistance levels.
Step 3: Watch Price Behavior Around the Levels
Here are useful hints on what you’ll be watching for:
- Support: If the price pulls back to one of these levels and holds, it is a sign that it could bounce upward again in line with the uptrend.
- Resistance: If the price rallies up to a level during a downtrend, it signals a likelihood that it might stall or fall from there.
The more a level aligns with previous price action, the stronger it becomes. Traders also look for other signs—like candles forming reversal patterns or volume spikes—to confirm their ideas.
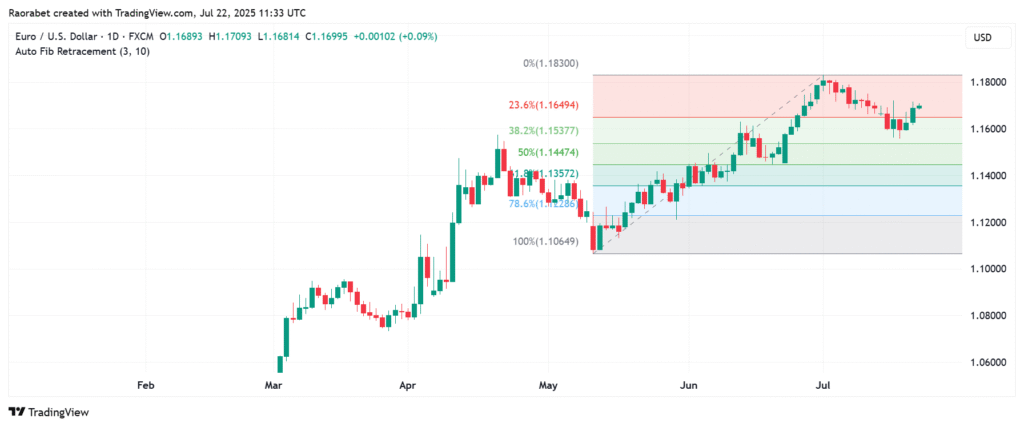
On the chart above, the recent bounce toward 1.1649 (23.6%) suggests that price is attempting to resume the upward trend, but traders should watch this level closely for potential resistance. The 23.6% retracement level (1.1649) held briefly as a support zone during the initial pullback from 1.1830. However, the price eventually broke below it, indicating that bullish momentum was weakening. After the drop, the currency pair has recently bounced back up, and it’s now acting as resistance.
The EUR/USD pair found solid support at the 61.8% retracement (Golden Ratio) level after briefly dipping below it, before resuming its upward move. This behavior aligns with classical Fibonacci theory — many traders consider this a high-probability bounce zone.
Common Mistakes and Misunderstandings
While the Fibonacci retracement tool is helpful, but it’s not a magic formula. Therefore, it’s not wise to get overly reliant on it and ignore the broader market context.
Here are the key mistakes to avoid:
- Don’t use Fibonacci retracement in sideways (range-bound) markets—it is only useful in a defined uptrend or downtrend.
- Don’t enter trades blindly at a Fibonacci level without confirming price behavior.
- The market is full of surprises and will not respect these levels every single time. So don’t expect Fibonacci to work every time.
Pro Tip: Combine Fibonacci with Other Indicators
Fibonacci retracement is a good technical analysis tool, but when combined with other tools, it becomes great.
Some of the other indicators you can combine it with include:
- Moving Averages (MAs) – These will help you to identify trend strength.
- RSI (Relative Strength Index) – This indicator has a 1 to 100 range and you can use it to confirm overbought (above 70) or oversold (below 30) conditions.
- MACD (Moving Average Convergence Divergence) – This indicator will help you to confirm the validity of a trend.
- Candlestick Patterns – to spot reversals or continuations around Fibonacci levels.
- Volume – trading volumes tell us the appetite investors have for a particular stock. When volumes rise or fall, we get to see how strong or weak the market move really is.
In Summary
Fibonacci retracement doesn’t tell you exactly what will happen, but it gives you a good idea of where price might take a breather or make a U-turn. Whether you’re trading crypto, stocks, forex, or even commodities, this is a useful tool to have in your technical analysis.
However, remember that it’s not the only tool, and neither is it sufficient on its own. To use it wisely, you need to combine it with other tools, and always stick to your trading plan. The markets may be unpredictable, but with the right approach, you can navigate them much more confidently.