- Candlesticks are a type of graphic used in technical analysis of an asset to display its high, low, open, and close prices over a period.
If you’ve ever peeked at a stock, commodity, crypto, or forex chart, you’ve probably seen them populated with red and green rectangles with little lines sticking out of them. Those are called candlesticks, and understanding how they work is key to becoming a successful trader.
What Are Candlesticks?
Candlesticks are a type of graphic used in technical analysis of a traded asset to display its high, low, open, and close prices over a specific time period.
When looking at the price movement of a stock like Nvidia, a currency pair like EURUSD or a crypto like Bitcoin. Instead of just seeing a single line that connects price points, candlesticks will give you a full visual of how price behaved during each specific time frame. That period can be a minute, an hour, a day, or even a month.
Beyond telling us the price movement, each candlestick tells a story of market sentiment and trader psychology during that time.
Parts of A Candlestick
Each single candlestick consists of three main parts:
- The Body – This is the thick part of the candle. Its uppermost and bottom parts show the range between the opening and closing prices. If the candle is green (or white in some platforms), it means the price closed higher than it opened. If it’s red (or black in some platforms), it means the closing price was lower than the opening price.
- The Wick (or Shadow) – These are the thin lines sticking out above and below the body. The top wick shows the highest price the asset reached during a particular time frame. The bottom wick shows the lowest price the asset reached.
- Open and Close – These are the starting and ending prices for the time frame. On a green candle, the open is at the bottom of the body and the close is at the top. The reverse is true for a red candle
Let’s say Bitcoin opened at $30,000, shot up to $31,000, dropped to $29,500, and then closed at $30,500 during a 1-hour period. That’s a classic green candle—with a body from $30,000 to $30,500, a top wick to $31,000, and a bottom wick to $29,500.
What do Candlesticks Tell Us?
As highlighted above, candlesticks do more than just showing price—they reflect market sentiment and depict trader psychology. By looking at candlesticks (and candlestick patterns), we can tell whether the buyers are in control, if the sellers are gaining strength and a reversal is imminent, a market waiting for a catalyst to break out from sideways action etc, and you can see all these and make appropriate decisions in real time. In essence, candlesticks and candlestick patterns give traders more information than simple line charts.
Popular Candlestick Patterns and What They Mean
Interpreting candlesticks is not where it ends. Actual trading typically involves studying the alignment and trajectory of multiple candlesticks, commonly known as patterns. When candlesticks are lined up a certain way, they can signal potential reversals, impending breakouts or continuation of trends. Here are some common patterns:
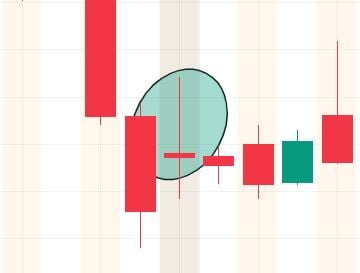
1. Doji
This pattern looks like a cross or a plus sign. In a Doji pattern, the opening and closing price are almost the same. It appearance signals a near-balance between buying and selling momentum, with most traders likely at a crossroads. It often signals an imminent reversal if it appears after a strong trend.
2. Hammer
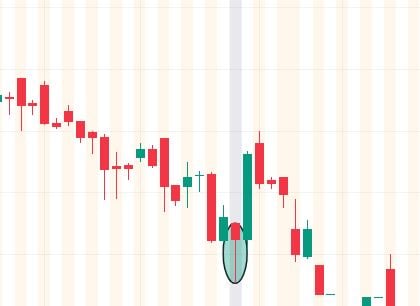
Like its name suggests, this pattern looks like a hammer. It has a small body at the top and a long lower wick. It denotes strong rejection of lower prices and often gives way to a bullish reversal if it appears at the bottom of a downtrend.
3. Shooting Star
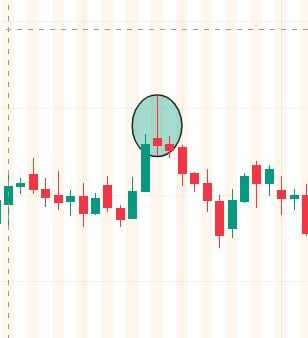
This pattern is the opposite of the hammer’s shape. It consists of a small body at the bottom and a long upper wick. It often signals a likely bearish reversal if it appears at the top of an uptrend.
4. Engulfing Patterns
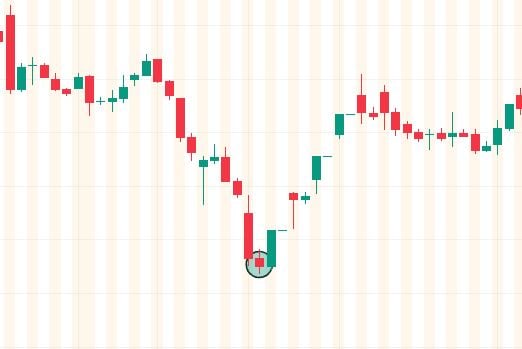
These can either be bullish or bearish engulfing patterns. A bullish engulfing pattern consists of a small red candle, which is followed by a larger green candle that completely “engulfs” it. On the other hand, a bearish engulfing has a small green candle followed by a larger red one which engulfs it. Both patterns typically signal impending momentum shifts and can usher strong reversals.
5. Inside Bar
An inside bar is a candle formed entirely within the range of the previous one. Its appearance often signals a consolidation or a potential breakout.
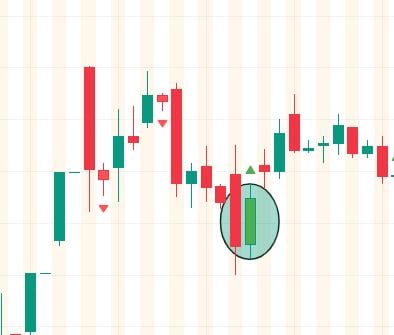
There are multiple candlestick patterns in markets, but these are some of the most commonly used ones.
How to Use Candlesticks in Trading
Knowing the patterns is one thing, but what matters most is how to actually use them. Below we take you through a step-by-step guide:
1. Choose Your Chart Time Frame
The first thing is to define what type of trader you are. That means predetermining when you will enter and close a trading position. For instance, scalpers use time frames set in seconds, day traders often use 1-minute, 5-minute, or 15-minute time frames. On the other hand, swing traders typically target periods of price swings, and often trade using 4-hour or daily charts. Finally, long-term traders have each of their candlesticks set to weeks or months.
2. Identify the Trend
The next step is to look at the arrangement of the candlesticks in the chart- both historical and recent. For instance, if they are registering higher highs and higher lows, with most of them being green, it denotes an uptrend, i.e. a bullish market.
Conversely, if the candlesticks are registering lower highs and lower lows with mostly red candlesticks dominating, it means the sellers are in control and a downtrend is in play. A range-bound market will have a near-balance between the red and green candlesticks, with the trajectory going sideways.
Trends are important, as they can present you with good opportunities to enter or exit positions.
3. Spot Patterns
You will need to look for candlestick patterns as discussed above. In addition to the patterns discussed, other commonly traded patterns include piercing line, morning star, evening star etc. While at it, find out where the price is repeatedly getting rejected (resistance level) and the level below which the market will not sell (support level). These will help you define your, entry point as well as take profit/ stop loss levels.
4. Confirm with Volume or Indicators
Candlesticks and their patterns are not sufficient on their own to make trading decisions. Instead, you need to combine them with momentum tools like RSI, MACD, Money Flow Index (MFI) or moving averages for stronger confirmation.
For example, a bullish engulfing pattern with rising volume at a known support level is a much stronger buy signal than a bullish engulfing pattern.
5. Manage Risk
Even with the most thoroughly analysed market, there are no assurances in markets. Tharefore, you need to set in place measures that limit your exposure to losses. It is advisable to always set a stop-loss below the wick or recent lows if you’ve placed a bullish position. On the other hand, you should place it above the wick or recent high if you have bet against the asset (bearish position).
6. Practice
Before going live and comiting your capital, you should test candlestick strategies on a demo account where you will trade using virtual currency. Also, you need to backtest historical charts.
7. Be alert on market news
Ultimately, markets react to developments in the world that can disrupt supply and demand. Therefore, while candlesticks and other technical tools help us to analyse markets, the actual forces behind the price movement is often out there in the world. Things like new trade tariffs, new taxes, geopolitical rifts, government incentives, stimulus packages etc have a major impact on price movement.
In Conclusion
Candlesticks not only tell us about price movement, but they are a graphical display of the market sentiment. They tell us when traders are getting greedy, scared, undecided, or excited.
However, they can never predict the future with 100% accuracy, and that’s why you need to combine them with other technical analysis tools like moving average and momentum indicators. Also, practice adequately and be on the lookout for shifts in market fundamentals, while keeping a solid strategy and disciplined mindset.


