- The Kusama price prediction indicates the potential for a deep correction to the south, due to lack of positive market-moving triggers.
Kusama price predictions appear to be heading the way of most altcoins analyzed on this site. The presence of lower prices on the day amid patterns that have bearish connotations are all symptoms of negative market sentiment.
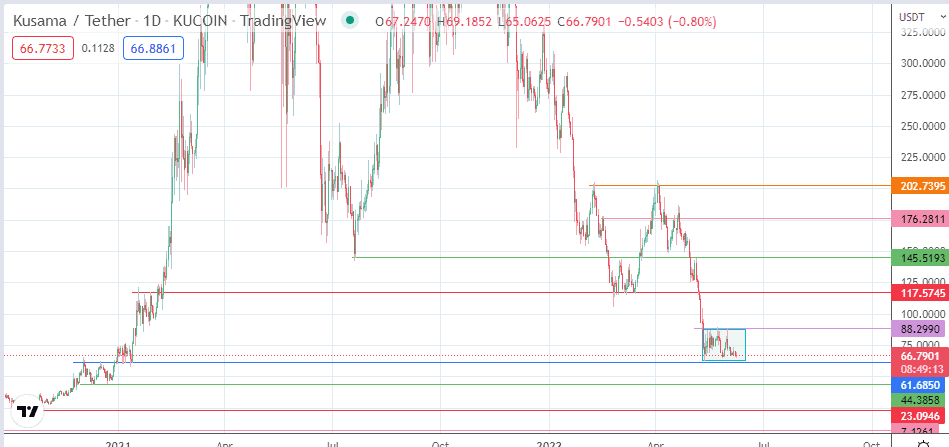
Price action on the KSM/USDT chart shows that the asset is now trading in a narrow range, formed by the flag consolidation area following the slump from 117.57 to 61.685. This decline followed the formation of a bearish engulfing pattern on 4/5 May, with a rejection at the 145.5193 resistance level.
The slight rally in the pair following the 13 April unlock of the crowdloan token, and other short-lived rallies only served to present new areas with which to short the token. The bearish flag gives an expectation of a bearish continuation of price action. With the daily candle showing a decline by 1.10% and now pushing for a test of the 61.6850 support, what is the Kusama price prediction heading into the weekend?

Kusama Price Prediction
the bearish flag on the daily chart points to a potential downside resolution. This requires a breakdown of the flag’s floor at 61.6850. A successful breakdown of this floor allows the bears to push for the 44.3858 price level (double bottom of 11 December/23 December 2020). Below this level, a further price decline will encounter the 23.0946 support (17 October and 26 October lows). 7.1261 constitutes another potential pivot, being the site of previous lows seen in July 2020.
Conversely, a strong bounce on the 61.6850 support that culminates in a break of the 88.2990 ceiling of the flag invalidates this pattern. This move also opens the way for the bulls to aim for 117.5745 (28 January high and 13 March low).
Additional barriers to the north are found at the 145.5193 resistance (5 May high) and the 202.7394 price mark (9 February and 3 April highs). However, intervening barriers may also exist at the 160.000 psychological price level and the 15 February and 17 April highs at 176.2811.
KSM/USDT: Daily Chart