
- Stay informed with our silver price technical analysis and learn what the oil-to-silver ratio reveals for investors in today's market.
The silver price edges higher 1.31% on Wednesday, trading around $77.70 per ounce. Investors are in a “wait and see” mood. The Middle East tensions are still alive despite the ceasefire extension. As long as the US maintains the blockade of Iranian ports viewed by Iranian authorities as a violation of the ceasefire, tensions are likely to remain elevated. At the same time, reports of attacks by Iranian forces on ships attempting to cross the waterway continue to add pressure to an already fragile peace process.
Silver-to-Oil Ratio Signals a Red Flag for Silver Prices
Looking at the silver price, there is a big warning: investors should pay attention to the current commodity cycle, the silver-to-oil ratio. Historically, this ratio averages roughly 0.30, meaning one ounce of silver typically buys about one-third of a barrel of oil. Today, the ratio has hovered near 1.0x ($73 silver vs. $100 Brent crude), putting it more than two standard deviations away from its historical mean.
What does this reveal? It suggests that silver may be overvalued while oil is severely undervalued. The oil-to-silver ratio has moved beyond its normal standard deviation range this month. This is driven by silver’s 35% correction from its January highs, which has brought the ratio down from its extreme 1.2x peak; the current 0.8x-1.0x range remains historically abnormal.
While the sixth consecutive year of physical silver deficits provides a fundamental floor for the metal, the inter-market ratio warns of a “valuation stretch.” If oil continues its climb toward $110 while silver remains capped by industrial demand fears, we may see this ratio “mean-revert” toward 0.50, suggesting silver may underperform oil in the coming quarter.

Silver Price Technical Analysis:
We highlighted in our last silver analysis that a potential breakout was coming from the former triangle patterns, and it’s already happened. Still, the breakout was weak, and the price didn’t manage to hold above the 79.00 level.
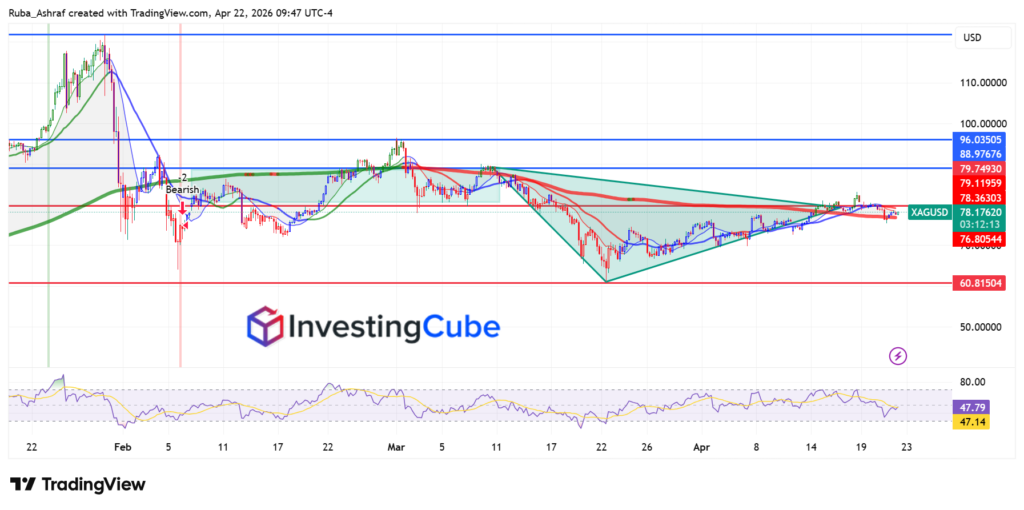
From a price action perspective, the chart shows that silver attempted to break higher after forming a descending triangle but quickly faced rejection near the 79.7–79.1 resistance zone.
In terms of moving averages, the shorter-term averages are flattening and slightly crossing sideways, reflecting the current consolidation phase. The longer-term moving average (green) is acting as dynamic resistance above the price, reinforcing the ceiling around the 79 area. This setup typically signals a lack of a strong trend and supports the sideways-to-bearish bias in the short term. The RSI is hovering in the neutral zone around the mid-40s to 50, indicating weak momentum.
Potential Scenarios:
- Bullish Breakout (Needs Confirmation): If Silver can hold the current support at $77.00 and reclaim the $79.11 level, the bullish narrative is revived. A successful breakout with high volume would quickly target the next major resistance zones at $88.97 and $96.03. For this to happen, we need to see a weakening of the US dollar or a significant “risk-off” move in the broader markets.
- Bearish Continuation: If price breaks below the 76.8 support, it would confirm renewed selling pressure, opening the door toward deeper levels near 73 and potentially 70. This would align with the broader downtrend still visible on the chart.
Patience is required here. The breakout was “weak” because it lacked the volume to clear the $80 psychological hurdle. Until we see a solid 4-hour candle close above $79.50, the risk of a retracement toward the $60.00 levels remains elevated.