Bearish Ethereum Classic price predictions have come on stream after Wednesday’s 9.05% decline took out the 21.23 support level. The intraday recovery is attempting to save this support, but there is not enough momentum yet to achieve this.
The evolution of the bearish flag on the daily chart makes for a potential continuation of the downside. This is as bullish sentiment is yet to return to the crypto market. Save for an upside spurt that occurred in the last one hour. The major altcoins have continued to face headwinds to recovery.
The Ethereum Classic price is down more than 60% since its April 2022 high at 52.46. The decline follows similar declines in Bitcoin and Ethereum. With Bitcoin precariously holding on to the 29,000 mark, there is a possibility that further selling could also impact the ETH/USDT pair similarly.
The Ethereum Classic price prediction is for the bearish flag to evolve successfully and send the price action towards the 9.17 support. However, this outlook is only invalidated when certain parameters are met, as indicated below.
Ethereum Classic Price Prediction
The decline of Wednesday violated the bearish flag’s lower border and the 21.23 support level. However, the bulls are attempting a return move to the broken support levels. The expectation is for these levels to act in role reversal to block the return, allowing for a continuation of the downward break towards 16.03 (12 May low). Below this level, the measured move could terminate at 3.60, with additional support levels at 11.65 (27 March 2021 low) and 9.17 (11 March 2021 high), having to give way for this to happen.
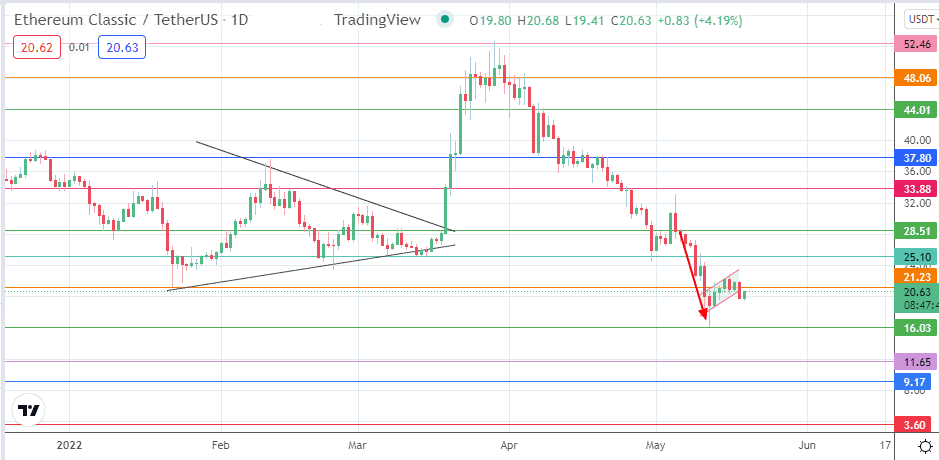
On the flip side, a recovery above 21.23 (22 January low) restores the sanctity of this support. This could allow a bounce that sends the price toward 25.10 (10 May high). Additional resistance levels are found at 28.51 (10 March and 6 May highs) and at 33.88 and 37.80 (11 February and 20 April highs). This outlook invalidates the bearish flag pattern.
ETC/USDT: Daily Chart