

- The Dow Jones Industrial Average has gained 7% since April and is currently surging toward the historic 50,000 milestone
- Tech stocks have helped support positive market sentiment amid jitters over Iran war
- Investors remain cautious as the sustainability of the rally depends heavily on stable energy costs and the successful resolution of Iran war
Following a strong April where gains surpassed 7%, the Dow Jones index is beginning May with notable momentum. Early trading today shows it advancing by over 1.1% intraday, currently positioned around 49,833 points.
But as we knock on the door of the psychological 50,000 mark, the air is getting a bit thin. Given the ongoing geopolitical tensions in the Middle East, questions arise regarding whether this represents the peak before a market correction, or the prelude to a substantial breakout.
The Geopolitical Wild Card
Geopolitics rarely hands markets a smooth ride. The Iran conflict has already caused oil spikes. Brent crude has seen dramatic swings, briefly topping $120–126 per barrel at peaks. While stocks have often shrugged off such shocks historically, prolonged uncertainty around energy flows can pressure multiples.
Nonetheless, the April rally indicates a degree of market resilience. Corporate earnings have remained relatively stable, and a degree of sector rotation, particularly into non-technology stocks, has contributed to the Dow’s occasional outperformance.
However, should these disruptions persist, increased input costs and persistent inflation might compel the Federal Reserve to adjust its policy stance, potentially dampening overall market sentiment. Markets hate uncertainty, right?
However, the reason we’re seeing green on the screens today is a wave of cautious optimism. Reports are surfacing that a ceasefire deal might actually hold, and oil prices have started to retreat back toward $100. When oil drops, the market breathes.
The Risk Near 50,000-Points
The Dow initially surpassed 50,000 in February, establishing intraday records within the 50,115 to 50,512 range. Following this, it experienced a retraction but has since been approaching those previous peak levels once more.

Psychologically, these levels often act as magnets and then magnets for profit-taking. Historical patterns indicate that resistance has formed near the 50,000 mark previously. Therefore, another approach could encourage selling by traders who view it as a logical exit following the recent ascent. When combined with geopolitical uncertainties, this scenario suggests a stronger likelihood of at least a moderate pause or a market correction.
But remember, milestones like this have often been followed by further gains over the longer term as the economy adapts. It’s not a ceiling forever.
Dow Jones Index Forecast
The Dow Jones RSI on the daily chart is hovering near 68, signaling that the index is approaching overbought. The immediate hurdle is 50,000, followed by the all-time high resistance zone of 50,400 to 50,544. If a correction begins, look for a major pivot at 49,000. Below that, secondary support sits at 48,326.
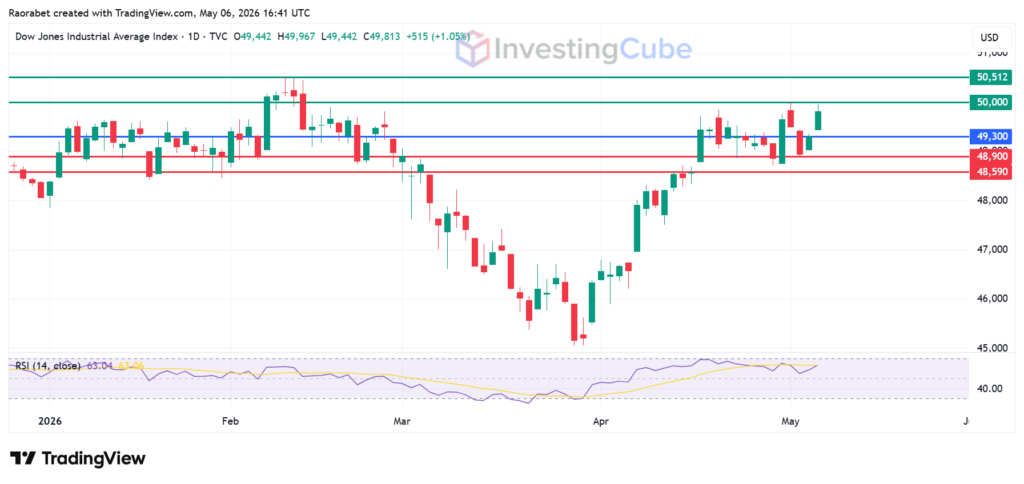
Dow Jones Industrial Average Index on May 6, 2026 showing the key levels of support and resistance. Created on TradingView
Investors are reacting to hopes of a ceasefire and declining oil prices. Additionally, strong corporate earnings in the AI and materials sectors are outweighing geopolitical fears for now.
While not guaranteed, it is a massive psychological barrier. Historically, round number milestones often trigger profit-taking as traders wait for confirmation of a sustainable breakout.
Look for a drop in trading volume on up days, an RSI reading above 70, and a failure to hold the 49,000 support level as primary warning signs.
