


- The closer the bitcoin price gets to the all-time high, the more bullish the commentary, which can often cloud things for traders.
The closer the bitcoin price gets to the all-time high, the more bullish the commentary, which can often cloud things for traders. Sometimes, the best strategy is to take a step back and look at the technical picture. Whilst Bitcoin’s (BTC) performance has been incredible over the last three weeks, there are signs that the bulls may be overly optimistic.
In September, Bitcoin crashed 25% from $53,000 down to $39,700 after China tightened the screws on the cryptocurrency industry. However, the die-hard Bitcoin bulls were unperturbed, reminding the market that Bitcoin typically performs well in the final three months of the year. So far in October, the bulls have been proved right. This morning, BTC traded at $58,550, the highest price since China’s crypto mining ban crashed the market in May. As a result, the financial press is filled with 6-digit price predictions. However, the Bitcoin price has done a lot of work in a short space of time which makes chasing the rally dangerous.
BTC Price Forecast
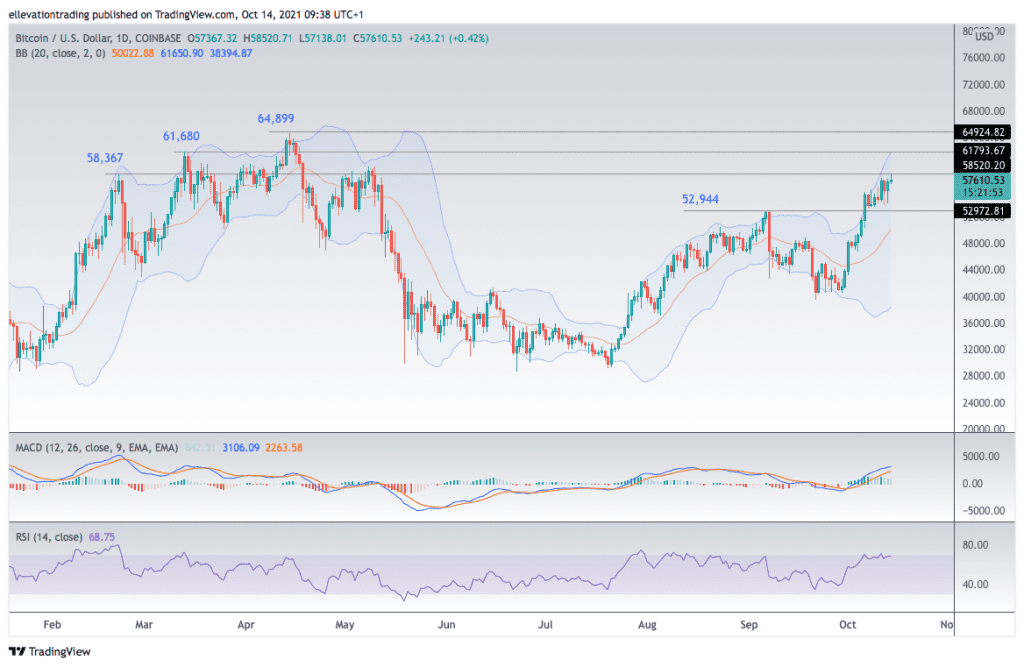
The daily chart shows that the Bitcoin price successfully cleared September’s $52,94 high, now the first significant support level. However, this morning, the former all-time high of $58,377 is proving sticky. BTC briefly pierced the level this morning but has since retreated $1,000, reinforcing its validity. Successful clearance of $58,367 brings the March 13th high of $61,680 into play. Following that, the $64,899 record comes next.
However, the Relative Strength Index reads 68.40, indicating the rally is close to overbought. However, previous bull runs had stretched the RSI as high as 80 before sharp corrections ensued. Nonetheless, if the Bitcoin Price extends towards $61,680, the RSI could reach historically high levels. Furthermore, at that stage, BTC will be trading at the top Bollinger band.
The higher Bolinger band at $61,599 represents a two standard deviation move from the 20-day moving average. As the chart shows, the former highs at $61,680 and $84,899 reversed after the price exceeded the top of the Bollinger channel. Therefore, $61,680 represent a considerable obstacle for the bulls.
When taking all of the inputs into account, you can build an argument that the Bitcoin price may be close to a near-term top. If that proves true, $52,944 is a critical level to watch. If BTC reverses below $52,944, it could flush many new-minted longs from their positions. In that event, $50k look probable.
For now, the bulls are still driving the Bitcoin bus, and the momentum is hard to fight. On that basis, the outlook is cautiously optimistic. However, longs should pay close attention to signs of exhaustion. Furthermore, the cautiously optimistic view relies on BTC holding above $52,944. A close below this level invalidates the short-term bullish outlook and suggest a breakdown is likely.
Bitcoin Price Chart (Daily)
For more market insights, follow Elliott on Twitter.