

- Learn why gold prices are being supported and how traders might position themselves for another upward leg in the gold prices.
Gold prices are coming back into the spotlight. At the time of writing, on June 22, it looked like gold prices were about to trigger an ascending triangle pattern with a target of $1,850.
It should be noted that gold prices have had a volatile year, but the trend in prices remains upwards, as it was in 2019. The two main reasons for the rise in 2020 is the coronavirus crisis and the fiscal and monetary response by governments and central banks, respectively. As a new wave of the Coronavirus is emerging in the USA, it could be the trigger that sends gold prices higher.
Download our Q2 Market Global Market Outlook
A second wave of the Coronavirus
The US seemed to have the coronavirus situation under control. On March 19, the California state shutdown, a few days later on March 22, New York followed in the same footsteps. The latter state was able to control the crisis, and we saw a peak in new cases in New York on April 15. On that day, 11,661 new coronavirus cases were registered, but the trend had already been downwards since April 4. On June 21, the number of new cases was 830, a drop of 92.8% from its peak.
In California, we saw a local maximum of 1,441 cases on April 7. However, on April 20, we saw a trend change, and the number of new cases reached 2,256. On June 20, a new maximum was reached as 4,363 new COVID-19 patients had been identified, an increase by a factor of 3.
In the whole of the USA, June 22 saw 33,388 cases, an evident change of about 22,000 cases per day at the start of June.
President Donald Trump is right to state that more testing is causing more cases to be identified. However, there is not a substantial increase between the numbers of tests from early June when approximately 22,000 new cases were identified per day. It is on both June 19 and 20 that the number of tests soared.
The likely explanation is that the relaxing of social distancing measures in the US and increased tests are driving the numbers higher.
It is also interesting to see that only about 2% of new positive cases require hospitalization, compared with about 12% at the start of April. It, therefore, appears that the human costs could be lower, as it could be asymptotic carriers that are being identified.

However, this does not have to matter for gold traders. Few people take time to understand what is driving new cases higher, and I think the psychological effects of higher COVID-19 cases can be enough to lift gold prices. The prior record of 39,072 cases occurred on April 24, and a break to this level could see gold prices rise.
Gold Prices Technical outlook
The trend in Gold prices is up since the summer of 2018 when prices were trading at $1,161 per ounce. Last summer we saw the price rise by 285 dollars per contract from the May low of 1,269.
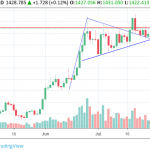
Today, the price is trapped in an ascending triangle pattern and is trying to breakout. The pattern is formed by drawing an upward sloping trend line via the April 21 and June 5 lows while a horizontal resistance level can be drawn via the May 20 high of $1,754.
Normally a close above the May 20 high should be enough to trigger the pattern that has a target of $1,850. However, a break to the 2020 high of $1,765 might be needed to confirm the breakout.
Tactically, we can see in the price action of June 20 that some traders are positioning themselves for the breakout with stops below the $1,737 level. Long-term traders will probably remain bullish as long as the price remains above the June 17 low of $1,712.