

- Gold price to fall below $1,750 in a risk-off environment. A triangle as a reversal pattern formed right below the $2,000, pointing to lower levels.
The week started with a weak stock market, and the gold price may suffer on the back of a strong USD. Gold hesitated at the $2,000 level and consolidated just below the round number. However, what many see as a continuation pattern, may turn into a triangle as a reversal pattern with a measured move stretching well below the $1,750 mark.
Because central banks around the world have the interest rates to the lower boundary, there is no interest rate differential to justify an investment into one currency or another. As such, correlations tightened, and a decline in the stock market triggers a risk-off environment across the board.
In a risk-off, the market buys the USD. Gold price denominated in the USD will suffer on the back of a weak stock market. If the futures rout continues, lower gold should not surprise anyone.
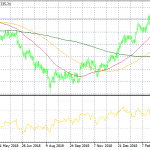
UBS Remains Bullish on GoldDow Jones Daily Chart
UBS raised its forecast for the gold price. It sees the yellow metal trading between $1,850 and $2,150 for the twelve months ahead, with potential for further gains.
Gold already gained 30% this year, reflecting the uncertainties created by the pandemic but also a weaker USD.

Gold Price Technical Analysis
After it broke above the $2,000 level and to a new all-time high, the gold price consolidated in a triangular pattern. A triangle has a series of lower highs and higher lows, and the breakout is followed by the price traveling to the measured move.
In this case, a bearish breakout means that the price will fall well below the apex of the previous triangle that broke higher. The measured move is the longest segment of the triangle projected from the breakout point, and it means that the gold price has room to fall below $1,750.
Bears would like to see a break below $1,900 before going short for the measured move, with a stop-loss order at $1,960.
Dow Jones Daily Chart
