
- Gold price looks bearish as it consolidates on the right shoulder of a pattern that should act as a continuation pattern. Is it too much to ask for $1,650?
Gold price forms a massive head and shoulders pattern on the daily chart, one that should act as a continuation pattern. Typically, head and shoulders patterns appear at the end of rising trends. However, during falling trends, they do not act as reversal patterns but as continuation ones.
The price of gold bounced back again from $1,800, but it looks only like a temporary bounce. Since the yellow metal managed to climb to a new record high above $2,000 last summer, it started a series of lower lows and lower highs, characteristic of bearish trends.
The dollar is in focus today as the United States is ready to transfer the power to Biden’s administration. Yesterday’s Yellen speech hinted that the U.S. is ready to let market forces determine the value of its currency and thus will not intervene anymore. For the dollar, this may be a game-changer.

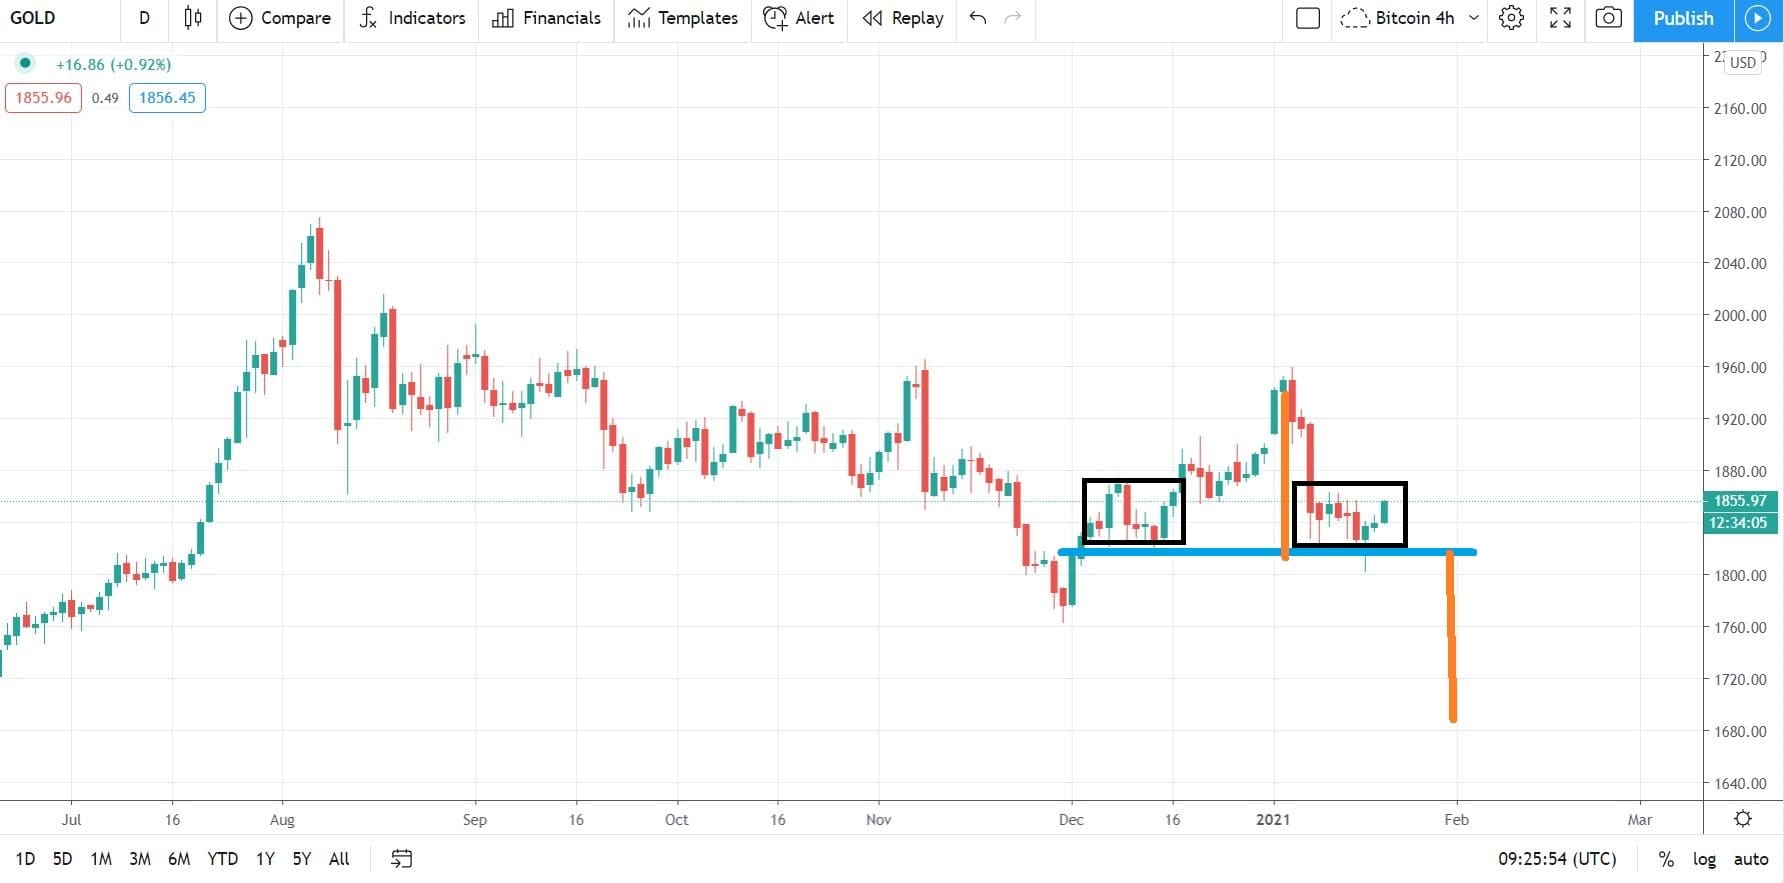
Gold Price Technical Analysis
The technical picture looks compelling enough for shorts. The current consolidation in the right shoulder of the pattern gives bear the opportunity to sell against the highest point (the most recent lower high). The measured move is the distance from the head to the neckline, projected from the neckline. It points to a drop below $1,650, giving a nice risk-reward ratio to shorts.
Dow Jones Daily Chart