
The GBPUSD pair is falling today as traders react to the rising risks of a no-deal Brexit and the overall stronger US dollar. The pair is trading at 1.3200 and is in its fourth straight day in the red. It is also below this year’s high of 1.3475.
The biggest concern for the GBUSD is news that the UK is preparing to pass a bill that will undermine the withdrawal treaty it signed in January. The government will publish the internal market bill on Wednesday. The goal of this bill is to ensure a seamless business activity between England, Wales, Scotland, and Northern Ireland.
A section in this bill will seek to eliminate the legal force of parts of the withdrawal agreement on areas like state aid and Northern Ireland customs. As a result, this bill will go contrary to what Boris Johnson signed in October in his bid to prevent a hard border with the European Union.
The revelations comes a few days after Boris Johnson said that the UK will do well even the two sides fails to reach an agreement. However, analysts disagree considering the volume of business that the UK does with the European Union. In 2019, the EU accounted for 47% of total trade the UK does. On the other hand, EU members exported goods worth less than 5% to the UK.
The GBPUSD pair is also falling because of the stronger US dollar. The dollar index, which measures the strength of the currency against a basket of peers is up by 0.30%, continuing a strong trend that started last week. This trend accelerated when the US released strong employment numbers that pushed the unemployment rate to 8.4%.
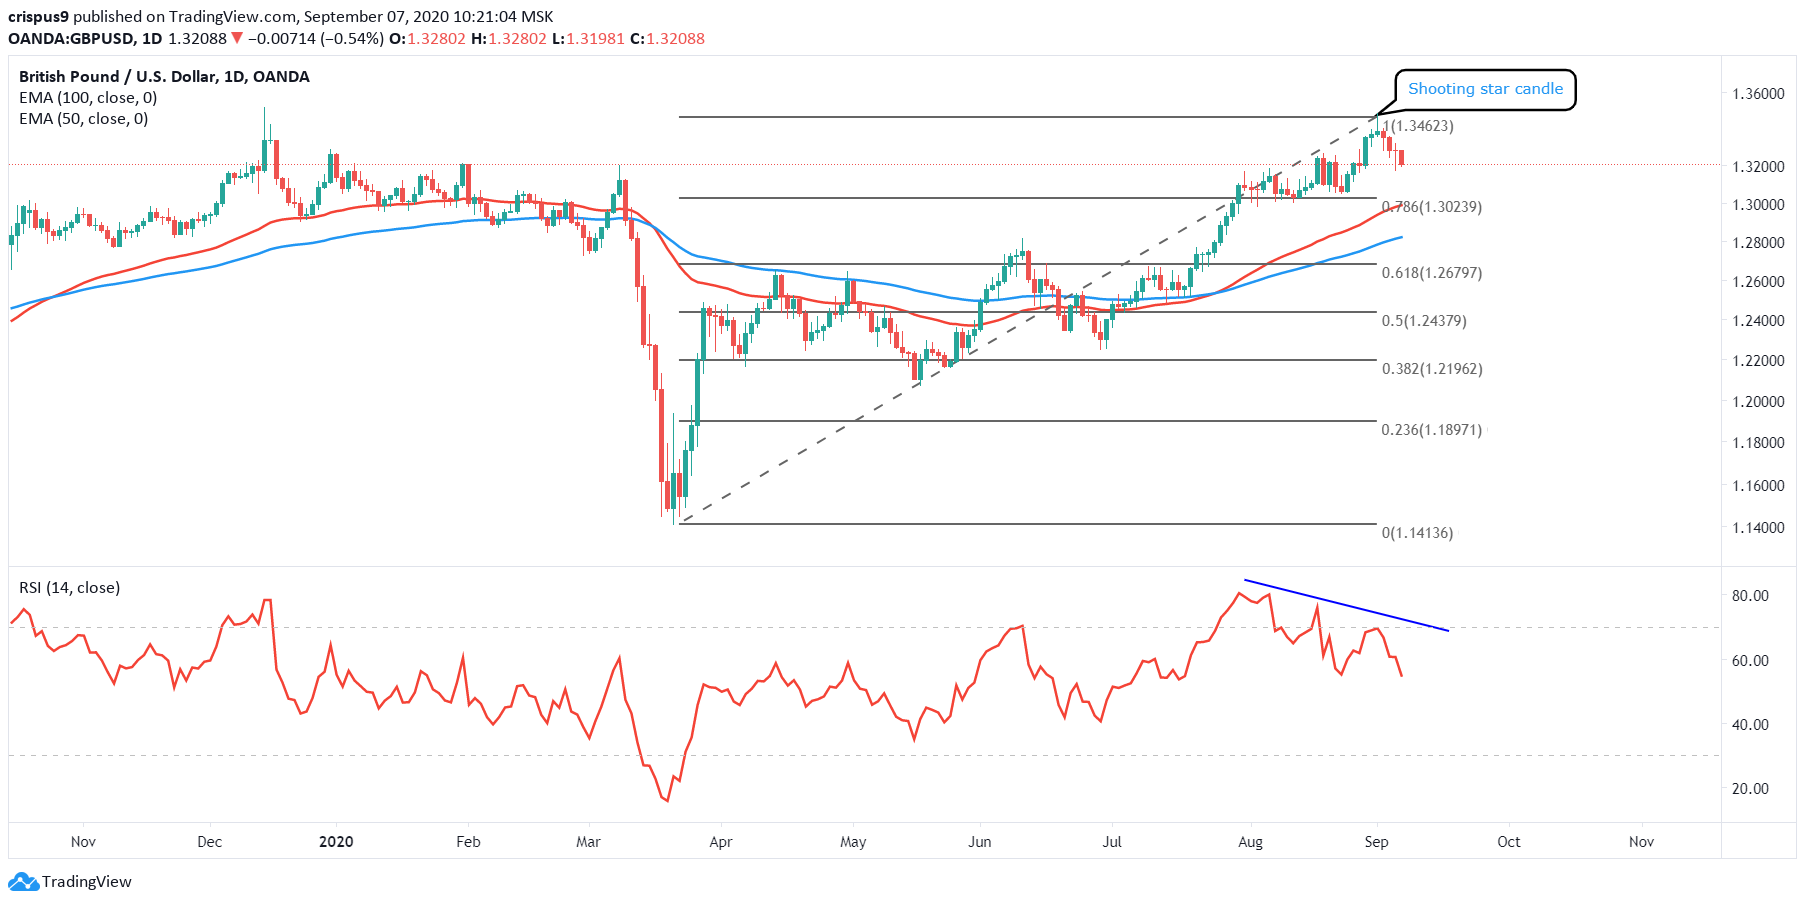
GBPUSD technical outlook
The daily chart below shows that the GBPUSD pair formed a shooting star candle on 1st September. As you can see in our free trading course, this pattern tends to be bearish in nature. Since then, the pair has been in a steep downward trend and is now trading at 1.3200. The price is still above the 50-day and 100-day exponential moving averages while the RSI has started to decline.
Therefore, I suspect that the pair will continue falling as bears target the next resistance at 1.3023, which is at the intersection of the 23.6% Fibonacci retracement level and the 50-day exponential moving averages. On the other hand, a move above last week’s high of 1.3462 will invalidate this trend.
Don’t miss a beat! Follow us on Telegram and Twitter.
GBPUSD technical chart
More content
- Download our latest quarterly market outlook for our longer-term trade ideas.
- Follow Crispus on Twitter.
- Do you enjoy reading our updates? Become a member today and access all restricted content. It is free to join.