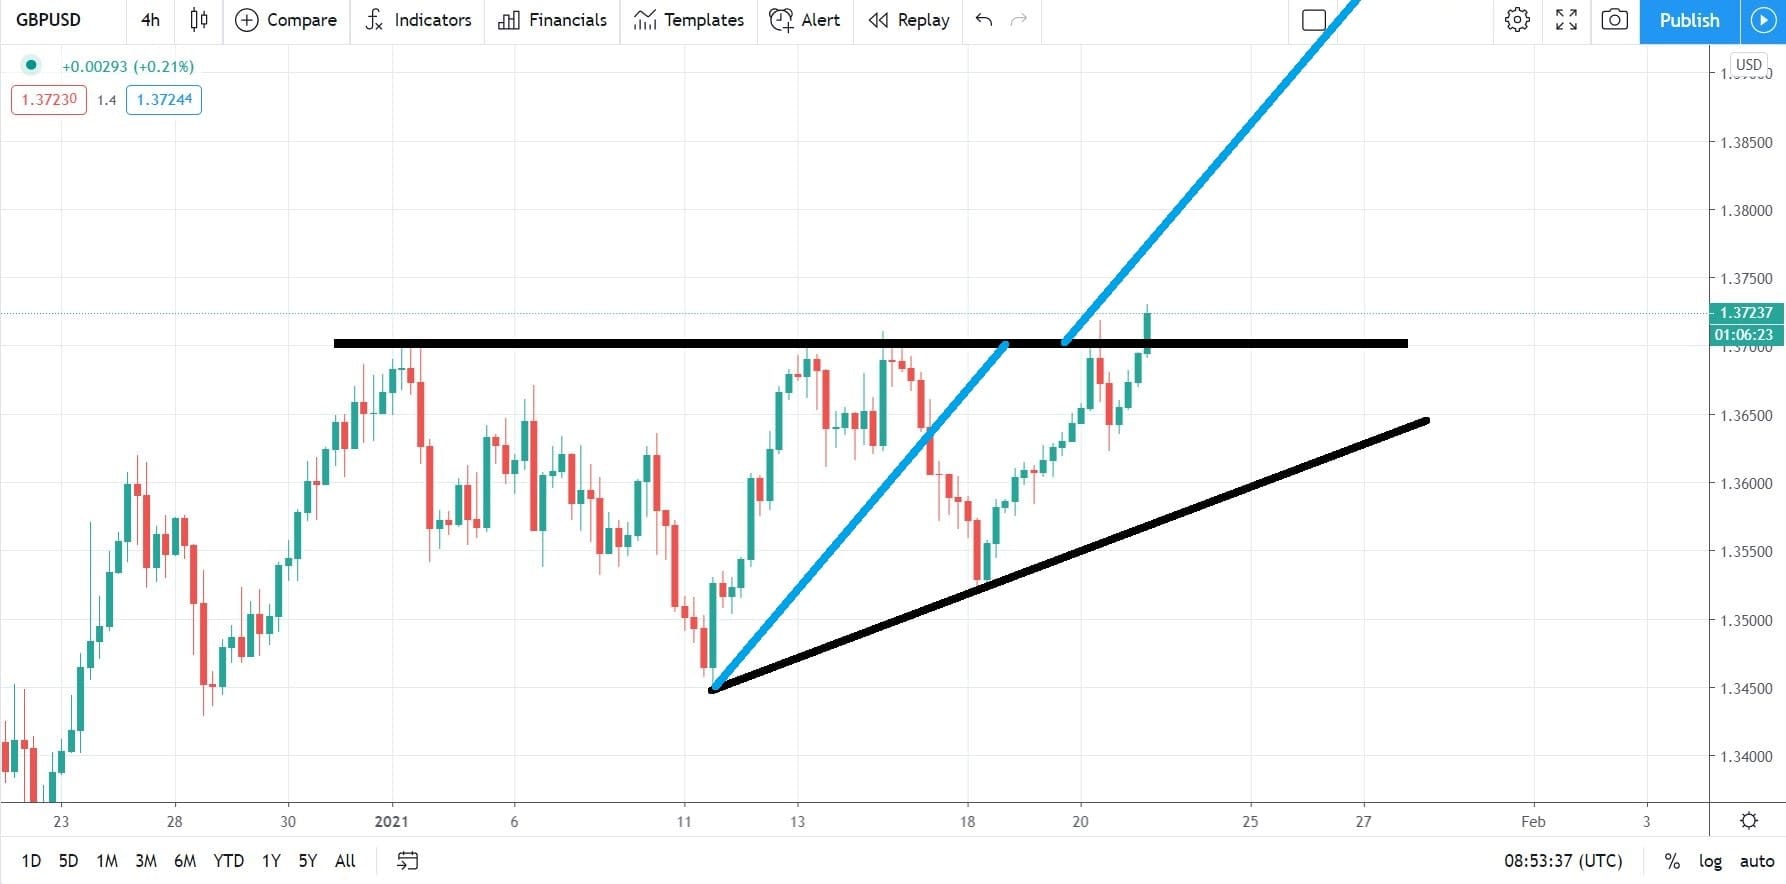

- GBPUSD ascending triangle points to 1.40 as per its measured move. The pair looks bullish here, providing it manages to close above resistance.
The GBPUSD consolidated since the new year started in what seems to be an ascending triangle. A pattern like this offers resistance against a horizontal level (1.37 in our case), and by the time the price breaks highs, the measured move equals the longest segment of the triangle. In other words, the pair looks poised to reach 1.40 on GBP strength rather than USD weakness.
The pound’s strength is visible across the board as other GBP crosses also trade with a bid tone. For example, the EURGBP fell close to 0.88, and the GBPCHF trades close to 1.22.
Yesterday’s Core CPI in the United Kingdom showed that inflation picks up faster than expectations. The pound took it as positive news in the sense that the chances are that the possibility of the Bank of England to lower the rates below zero drops dramatically.
GBPUSD Technical Analysis
An ascending triangle pattern is considered complete when the price breaks and closes above the horizontal resistance. Therefore, before going long, bulls may want to wait for the 4h candlestick to close above 1.37. Otherwise, the risk is that the market simply forms a false breakout.

But if such a close appears on the chart, bulls may want to go long with a stop loss order at 1.36 and target a move to 1.40 for a risk-reward ratio that exceeds 1-2.5.
GBPUSD Price Forecast