Archived Article This article was published more than 5 months ago. The market data, prices, forecasts, and analysis were accurate at the time of publication but may have changed since then. Please use this article for historical reference only and refer to our latest content for current market information.
- The GBP/USD is trading slightly higher after upbeat low-impact data, but all eyes will be on the US Core CPI data release.
On a day that has seen light activity on the GBP/USD pair due to a scanty economic news calendar, the GBP/USD pair is only slightly up by 0.11%. Barely supporting the Pound this Wednesday is the upbeat GDP m/m figure for May 2022, which came in at 0.5% (versus a consensus of 0.1%). This figure represents an increase above the -0.2% registered in April 2022.
Also helping to prop up the cable was better-than-expected Industrial and Manufacturing production data, which at 0.9% and 1.4%, respectively, beat both previous numbers and consensus estimates.
However, the slight gains made by the GBP/USD will face a test when the US Consumer Price Index data (m/m) for July 2022 is released by 12.30 pm GMT. The markets expect inflation at the consumer end of the spectrum to have risen from 1.0% to 1.1% (headline number). Core CPI is projected to drop from 0.6% to 0.5%. Higher-than-forecast figures could pressurize the pair and reverse any slight gains already made.

Trading volume on the GBP/USD is muted now, but expect significant volatility as the New York session kicks in.
GBP/USD Forecast
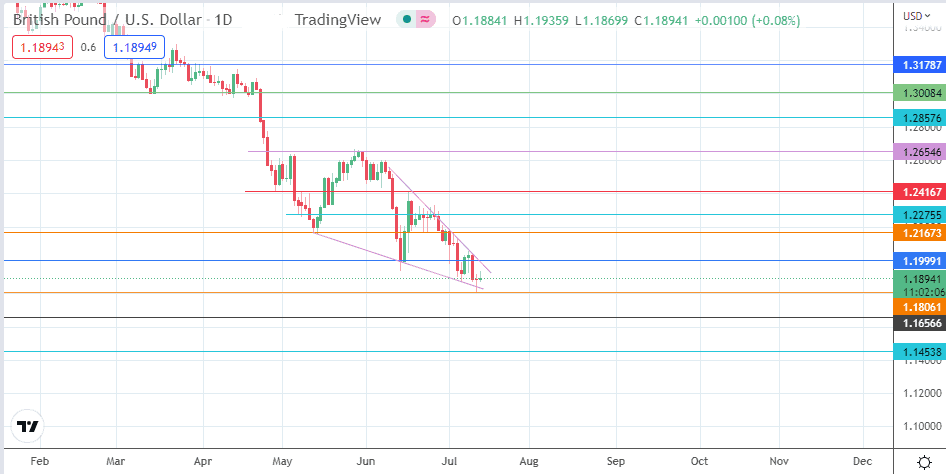
The hammer candle bounced off the 1.18061 support needs a longer bullish candle to confirm the upside push and challenge the resistance at the 1.19991 price level. This is also the location of the wedge’s upper border.
A break above this double resistance confirms the pattern’s bullish outlook and opens the door for a measured move towards the 1.24167 resistance level. This measured move must break the 1.21673 (12 May low and 4 July high) and 1.22755 (6 May low and 20 June high) resistance barriers in the process. A further extension of the upside move will have 1.26546 to contend with, being the location of the 30 May high.
On the flip side, a lack of bullish momentum puts the 1.16566 support under pressure. A breakdown of this low seen on 25 March 2020 opens the door towards the 1.14538 support line. This is where the confluence of lows of 18-24 March 2020 are found. Any further declines will clear the way for the bears to seek additional harvest points at a new record low for the pair.
GBP/USD: Daily Chart