

- The March CPI print of 2.6 percent confirms that energy shocks are filtering into the broader economy, forcing the ECB to weigh aggressive rate paths against a cooling growth outlook.
The EUR/USD pair struggled to find direction on Thursday after Eurostat confirmed that Eurozone inflation accelerated more than initially estimated in March, hitting 2.6% year-on-year.
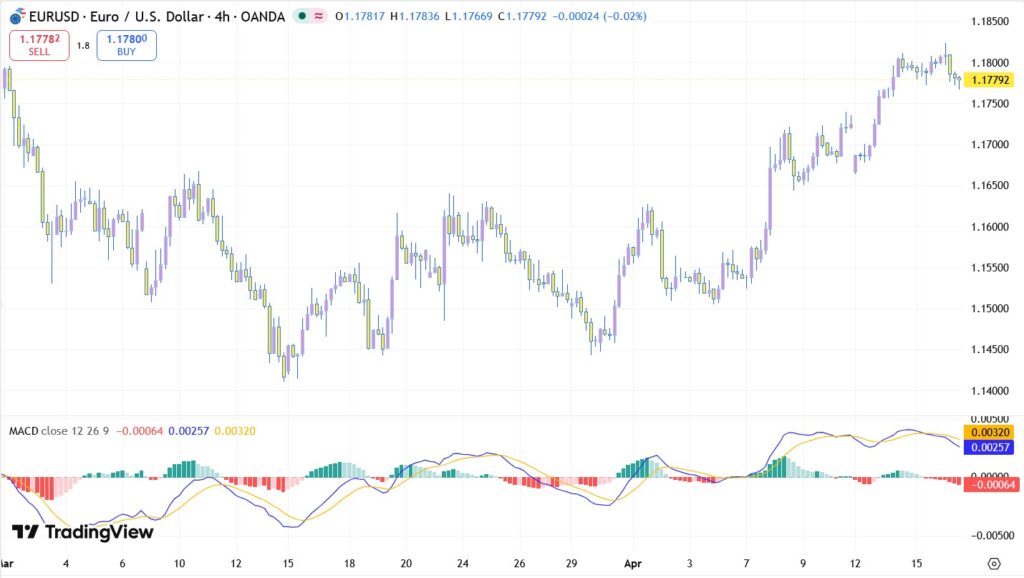
The pair traded near 1.1779 in the 4-hour chart, hovering just below the 1.1800 psychological level. The data reaffirmed what markets already suspected, surging energy costs from the Iran war are now firmly feeding into European price pressures.
Here is what the CPI report means for the euro, how the chart is shaping up, and where EUR/USD could go next.
Why did Eurozone CPI move higher for EUR/USD?
The headline number came in at 2.6% for March, above the preliminary estimate of 2.5% and well above February’s 1.9%. On a monthly basis, prices rose 1.3%, also exceeding the early reading of 1.2%.
The driver was no surprise: energy.
Energy prices jumped 5.1% annually and 7.0% month-on-month, according to Eurostat. The Middle East conflict has disrupted natural gas imports from Qatar and crude oil flows through the Strait of Hormuz. Both benchmarks remain well above pre-war levels despite recent ceasefire hopes.
Core CPI, which strips out energy and food, was confirmed at 2.3% year-on-year, down slightly from 2.4% in February. But analysts warn that the energy shock will eventually spill over into broader inflation.
For EUR/USD, higher inflation is a double-edged sword. It pressures the ECB to consider rate hikes, which would support the euro. But it also threatens growth in an energy-importing region, a negative for the currency.
EUR/USD technical breakdown
The 4-hour chart shows a market that has lost momentum after failing to break above 1.1800.
Key technical levels for EUR/USD today:
- Immediate resistance: 1.1800. The pair kissed 1.17972 and reversed. A clean break above this psychological level is needed for bulls to regain control.
- Critical support: 1.1750–1.1740. The pair is currently floating near 1.1778, but the MACD is flashing warning signs. The MACD line (-0.00064) is below the signal line (0.00257), and the histogram (0.00320) is shrinking. Momentum is fading to the downside.
- Market outlook: Price action has been choppy between 1.1750 and 1.1800 since the CPI release. Sellers are defending 1.1800, while buyers are stepping in near 1.1750. A breakout is overdue.
Will EUR/USD go up or down after the CPI confirmation?
The inflation print removes some uncertainty but doesn’t give a clear directional nudge. Here are the two paths.

- EUR/USD bearish scenario (higher probability) If the pair fails to break 1.1800 in the next 12 hours and rolls over below 1.1750, sellers will target 1.1720 and then 1.1680. The MACD divergence supports this view. Momentum is weakening while price is near resistance, a classic reversal signal.
- EUR/USD bullish scenario (needs a catalyst) A clean 4-hour close above 1.1800 would open the door to 1.1850. That would require either fresh dollar weakness or ECB hawkish commentary. The problem? The ECB minutes are due soon, and any hint of hesitation on rates will cap the upside.
- Speculative range for the next 48 hours: 1.1720 – 1.1850.
What should EUR/USD traders watch next?
Three things matter now.
1. ECB March meeting minutes.
Investors will pour through the minutes from the March 19 meeting, where rates were left at 2%. The key question: How worried are policymakers about energy feeding into core inflation? Any mention of “vigilance” or “data dependence” will move EUR/USD.
2. US data later this week.
Thursday also brings US jobless claims. A strong print could lift the dollar and push EUR/USD toward the lower end of the range. The safe-haven bid on the dollar isn’t dead — it’s just waiting for a reason.
3. Middle East headlines.
Ceasefire talks between the US and Iran remain fragile. Any breakdown would send oil prices higher and the dollar higher. Any progress would relieve pressure on the euro. This is still the dominant driver.
EUR/USD conclusion
The EUR/USD is currently defined by a tug-of-war between persistent inflationary pressures and the shifting tides of Middle East diplomacy. While the confirmed March CPI of 2.6% signals that the Eurozone is grappling with real price growth, the market remains primarily reactive to the “headline risk” stemming from the Strait of Hormuz.
As we look ahead, the ability of the pair to sustain a breakout above the 1.1800 barrier will depend less on traditional data and more on whether diplomatic channels can successfully de-escalate the energy supply crisis. For traders, the current environment demands a defensive posture; prioritize strict risk management and await confirmed technical setups, as the path of least resistance remains hostage to the next major geopolitical announcement.
Energy prices drove the surprise. The final reading of 2.6% year-on-year exceeded the preliminary 2.5% estimate because of surging oil and natural gas costs linked to the Iran war. Natural gas imports from Qatar have been disrupted by missile strikes, and crude flows through the Strait of Hormuz remain under threat. Energy inflation jumped 5.1% annually and 7.0% month-on-month.
It cuts both ways. Higher inflation pressures the ECB to consider rate hikes, which would support the euro. But Europe is a net energy importer, so rising oil and gas costs hurt growth and terms of trade. That is negative for the currency. Markets are currently torn between these two forces, which explains the choppy price action near 1.1780.