
- Last week, the Japanese Yen looks to have turned the corner (EURJPY), helped by the S&P 500 declining sharply, and new economic sanctions on Iran.
Last week, the Japanese Yen looks to have turned the corner, as it gained against most of its peers, helped by the S&P 500 declining sharply by the end of last week’s trading session, and new economic sanctions on Iran. In this article, we will take a look at how all of this affected the EURJPY and USDJPY.
Before last week’s gains in the Japanese yen, it had been depreciating as the ECB and Federal Reserve eased their monetary policy, prompting a rise in risk appetite, but also as US and China trade war tensions eased. The sharp rise in crude oil prices following the attack on Saudi crude oil production facilities did not have a material impact on risk-appetite, but the new US sanctions on Iran did.
On Friday, the Whitehouse unveiled a new strategy targeting the Iranian central bank, and the National Development Fund of Iran. US Treasury Secretary, Steven Mnuchin, said, “this is very big,” and “we’ve now cut off all source of funds to Iran.”

The new measures are sure to hurt the Iranian economy and could lead to further tension, and possibly military action. If the US and Iran were to enter a conventional war, then some economists are speculating that Brent crude oil prices could gain to $150 per barrel, sending the world into a recession, and annual global inflation to about four percent. All this tension appears to have boosted the Japanese Yen.
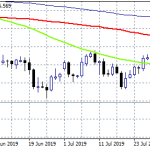
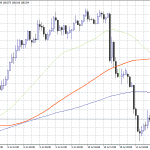
On Friday from midday London time, the EURJPY did not stop declining until the close, and it now looks like the September 13 high of 120.05 will be the next significant lower high. On September 13 the price turned lower as it was just about the reach the upper blue downward sloping trend line. The trend line is from an “Andrew’s pitchfork” that has been drawn using the August and September 2018, low and high respectively, and has done a relatively good job explaining EURJPY price action in 2019. The AUDJPY as was also close to reaching its blue downward sloping trend line before heading lower last week, while the NZDJPY downtrend had already been lower for a while. If the EURJPY indeed created a major high last week, then the pitchfork formation suggests that the EURJPY pair could reach the lower blue downward sloping trend line, currently at 115.64. However, if the EURJPY manages to trade above the September 13 high of 120.05, then it might send the price to the upper green downward sloping trend line at 122.15.As for the USDJPY, the trend is not firmly bearish as of yet, as the USD is strong against most of its peers, however, on the price trading below the September 15 low of 107.45 it might turn the short-term trend bearish, and could cause traders to target the September 3 low at 105.72. The longer term trend in USDJPY is bearish since November 2018, and will remains downwards as long as the price trades below the August first high of 109.30.