The EUR/USD exchange rate has continued it recovery in the past few months as the US dollar index (DXY) has pulled back. EUR to USD price was trading at 1.0873 on Friday morning ahead of the upcoming PCE data. Economists expect that the headline PCE dropped from 5.5% in November to 4.9% in December. Core PCE is expected to come in at 0.3%.
These numbers will come in a few days ahead of the upcoming Fed decision that will set the tone for the year. The meeting comes at a time when the US is sending mixed signals about the state of the economy. On Thursday, GDP data revealed that the economy slowed down at a better pace than expected. Retail sales have plunged while the property market is in trouble. Many high-flying tech companies like IBM, Microsoft, and Salesforce have announced layoffs. This is a sign that the Fed will continue pivoting.
EUR/USD daily chart analysis
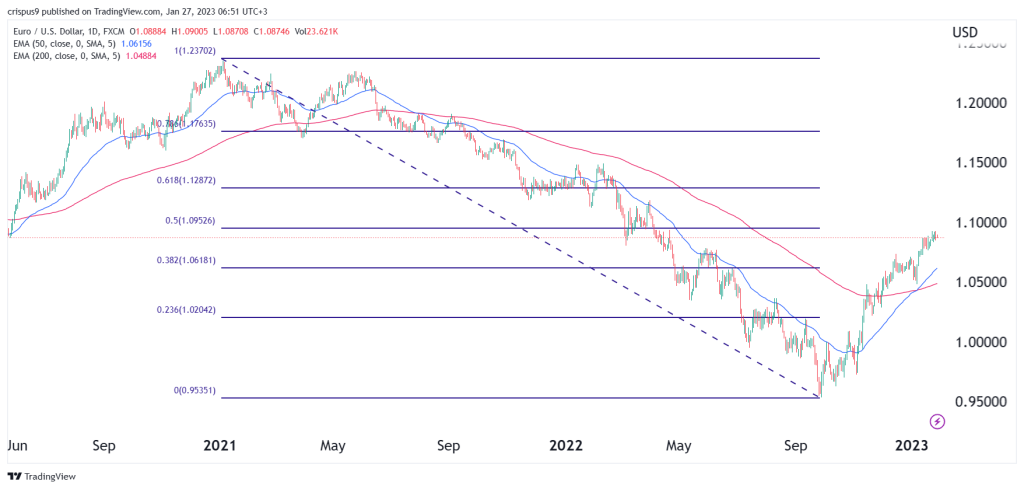
My last EURUSD forecast was accurate as the pair managed to rise to the key resistance at 1.1100. Turning to the daily chart, we see that the EUR to USD price has been in a strong bullish trend in the past few days. The pair is now hovering near the 50% Fibonacci Retracement level. In most cases, an assets that is rising tends to lose momentum or consolidate when it hits this level.
Meanwhile, by looking at moving averages, we see that the pair has formed a golden cross as the 200-day and 50-day MAs have made a bullish crossover. This is a sign that the pair will likely continue rising in the longer term. If this happens, the next key level to watch will be at the 61.8% Fibonacci Retracement level at 1.1284, which is almost 4% above the current level. On the flip side, a drop below the key support at 1.0750 will invalidate the bullish view.

EUR to USD 4H chart analysis
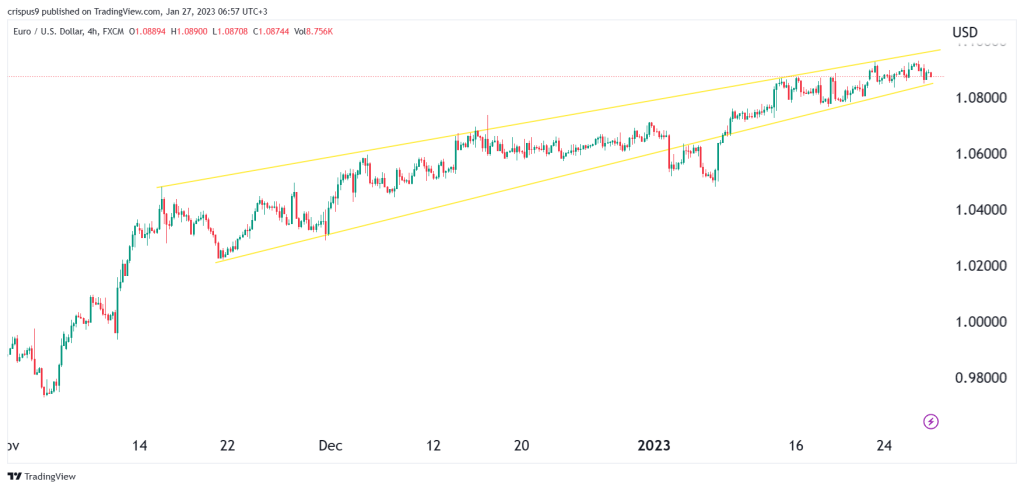
Turning to the 4H chart, we also see that the pair has been in a strong bullish trend in the past few months. However, the chart clearly shows that the bullish momentum is losing stream. And a closer assessment reveals that it has formed a rising wedge pattern that I have shown in orange.
A wedge is usually a sign of a reversal. Now, with it nearing its confluence level, I suspect that the EUR/USD pair will have a bearish breakout in the near term, possibly before or after next week’s Fed decision. If this happens, the EUR/USD price will likely drop to a low of 1.0700, the lowest point since January 9.


