Our last Ethereum price prediction is hanging by a thread due to the formation of a bearish pattern. However, ETH price appears to be reversing after getting rejected from the key psychological level of $2000. Nevertheless, with the Merge upgrade on the horizon, the fundamentals appear to be stronger than ever.
Cryptocurrency prices plummeted at the end of last week as BTC and ETH failed to reclaim key levels of $25,000 and $2,000, respectively. After multiple attempts, the two biggest digital assets retracted back to their respective supports. However, the bulls were not ready to absorb the sell pressure, and the prices marked new monthly lows.
At the time of writing, Ethereum price is trading at $1612. However, the native asset of the smart contract platform has lost 0.82% during Tuesday’s trading session so far. This sudden price reversal has surprised many swing traders as the markets were anticipating a much bullish price action before the upgrade.
According to Ethereum news today, the staking rate has increased by 11% in anticipation of the ETH Merge. As per OKLink, 36,000 ETH have been added to the staking contract every week since the start of August.
Ethereum Price Prediction
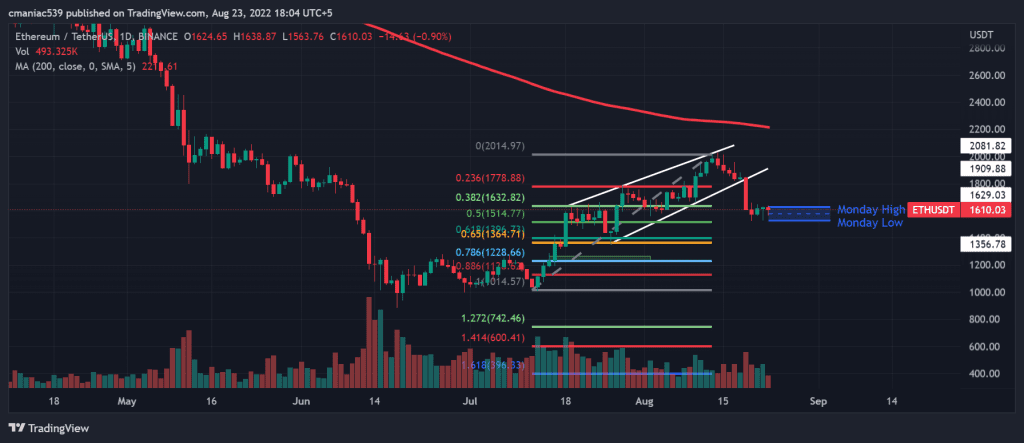
The ETH USD price chart depicts a rising wedge pattern formed by a big breakdown. Such breakdowns tend to be very bearish as the price targets the bottom of the wedge most of the time. This gives us a price target of $1356, which perfectly aligns with the 0.618-0.65 Fib golden pocket region.
As long as the price stays below the 200 MA on the 4H chart, the above Ethereum price prediction would remain valid. The 4H 200 MA currently lies at $1700. Therefore, any daily closure above this level would act as a symbol of strength.
It is also worth mentioning here that a daily closure below Fib golden pocket, i.e., $1364, could take the price to $1,230. However, with the Merge approaching next month, it is better not to short Ethereum as it might show abnormal price action. If you still want to trade this setup, then the best place to trade is BYBIT.
Ethereum Daily Chart
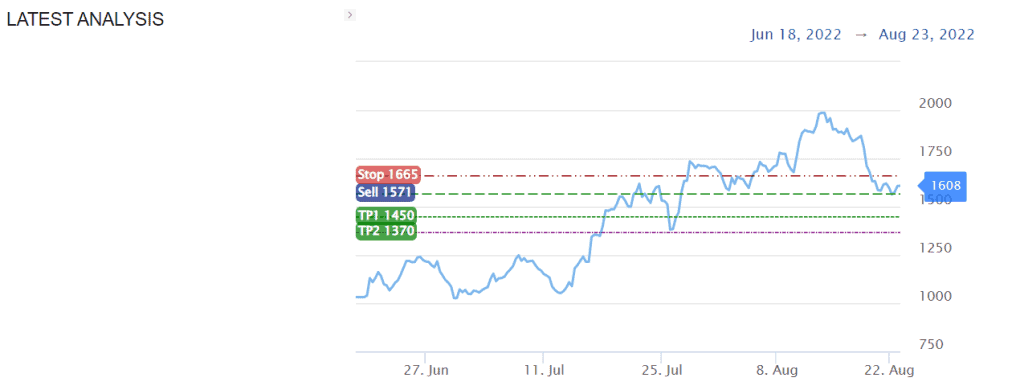
Ethereum Analysis by S&R Levels
Trading cryptocurrencies on your own could be overwhelming for new investors. However, subscribing to our InvestingCube Premium S&R Levels always gives you an edge by keeping you updated on all the latest trade setups.
Currently, the indicator is suggesting an ETH short setup with an entry above $1570. The targets of these trades. i.e., $1450 and $1370 somehow align with our Ethereum price prediction described above.